
Advertisement
- India
- /
- Oil and Gas
- /
- NSEI:RELIANCE
What Is Reliance Industries's (NSE:RELIANCE) P/E Ratio After Its Share Price Tanked?
To the annoyance of some shareholders, Reliance Industries (NSE:RELIANCE) shares are down a considerable 32% in the last month. Even longer term holders have taken a real hit with the stock declining 25% in the last year.
All else being equal, a share price drop should make a stock more attractive to potential investors. In the long term, share prices tend to follow earnings per share, but in the short term prices bounce around in response to short term factors (which are not always obvious). So, on certain occasions, long term focussed investors try to take advantage of pessimistic expectations to buy shares at a better price. One way to gauge market expectations of a stock is to look at its Price to Earnings Ratio (PE Ratio). A high P/E implies that investors have high expectations of what a company can achieve compared to a company with a low P/E ratio.
View our latest analysis for Reliance Industries
Does Reliance Industries Have A Relatively High Or Low P/E For Its Industry?
We can tell from its P/E ratio of 14.22 that there is some investor optimism about Reliance Industries. The image below shows that Reliance Industries has a higher P/E than the average (7.3) P/E for companies in the oil and gas industry.
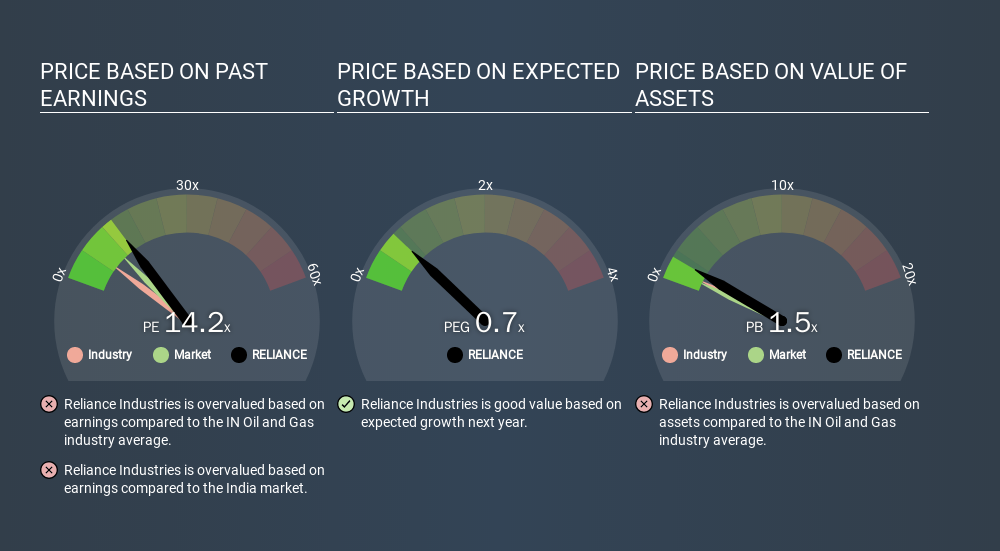
Its relatively high P/E ratio indicates that Reliance Industries shareholders think it will perform better than other companies in its industry classification. Shareholders are clearly optimistic, but the future is always uncertain. So investors should delve deeper. I like to check if company insiders have been buying or selling.
How Growth Rates Impact P/E Ratios
P/E ratios primarily reflect market expectations around earnings growth rates. If earnings are growing quickly, then the 'E' in the equation will increase faster than it would otherwise. That means unless the share price increases, the P/E will reduce in a few years. Then, a lower P/E should attract more buyers, pushing the share price up.
Reliance Industries's earnings per share grew by -9.5% in the last twelve months. And it has bolstered its earnings per share by 13% per year over the last five years.
Remember: P/E Ratios Don't Consider The Balance Sheet
The 'Price' in P/E reflects the market capitalization of the company. That means it doesn't take debt or cash into account. In theory, a company can lower its future P/E ratio by using cash or debt to invest in growth.
Spending on growth might be good or bad a few years later, but the point is that the P/E ratio does not account for the option (or lack thereof).
So What Does Reliance Industries's Balance Sheet Tell Us?
Net debt totals 24% of Reliance Industries's market cap. This could bring some additional risk, and reduce the number of investment options for management; worth remembering if you compare its P/E to businesses without debt.
The Verdict On Reliance Industries's P/E Ratio
Reliance Industries's P/E is 14.2 which is above average (10.8) in its market. With modest debt relative to its size, and modest earnings growth, the market is likely expecting sustained long-term growth, if not a near-term improvement. Given Reliance Industries's P/E ratio has declined from 20.8 to 14.2 in the last month, we know for sure that the market is significantly less confident about the business today, than it was back then. For those who prefer to invest with the flow of momentum, that might be a bad sign, but for a contrarian, it may signal opportunity.
When the market is wrong about a stock, it gives savvy investors an opportunity. If the reality for a company is better than it expects, you can make money by buying and holding for the long term. So this free report on the analyst consensus forecasts could help you make a master move on this stock.
You might be able to find a better buy than Reliance Industries. If you want a selection of possible winners, check out this free list of interesting companies that trade on a P/E below 20 (but have proven they can grow earnings).
If you spot an error that warrants correction, please contact the editor at editorial-team@simplywallst.com. This article by Simply Wall St is general in nature. It does not constitute a recommendation to buy or sell any stock, and does not take account of your objectives, or your financial situation. Simply Wall St has no position in the stocks mentioned.
We aim to bring you long-term focused research analysis driven by fundamental data. Note that our analysis may not factor in the latest price-sensitive company announcements or qualitative material. Thank you for reading.
About NSEI:RELIANCE
Reliance Industries
Engages in hydrocarbon exploration and production, oil and chemicals, textile, retail, digital, material and composites, renewables, and financial services businesses worldwide.
Flawless balance sheet established dividend payer.
Similar Companies
Market Insights


Advertisement
Community Narratives
The Future of Drug Testing? Fingerprint Tech Shows Serious Promise
Fair Value US$2.98|38.6% undervalued
JO
Community Contributor
Suncorp’s Next Chapter: Insurance-Only and Ready to Grow
Fair Value AU$22.83|5.7% undervalued
RO
Community Contributor
Thyssenkrupp Nucera Will Achieve Double-Digit Profits by 2030 Boosted by Hydrogen Growth
Fair Value €14.40|31.6% undervalued
CH
Community Contributor
Tesla’s Nvidia Moment – The AI & Robotics Inflection Point
Fair Value US$384.84|18.0% undervalued
BL
Community Contributor