- India
- /
- Oil and Gas
- /
- NSEI:MRPL
Mangalore Refinery and Petrochemicals Limited's (NSE:MRPL) Intrinsic Value Is Potentially 23% Below Its Share Price

Key Insights
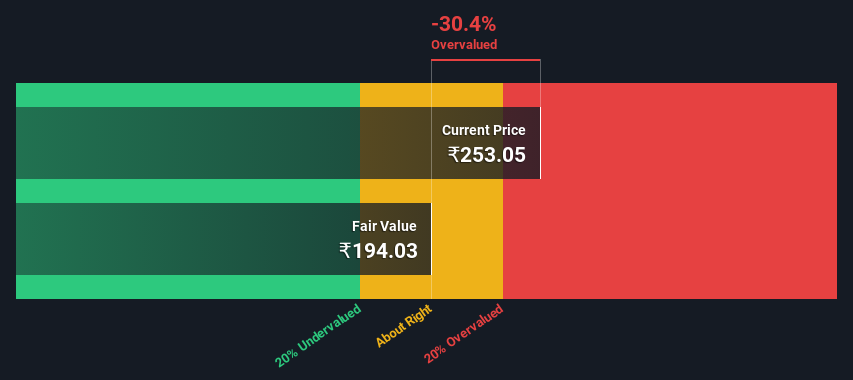
- Mangalore Refinery and Petrochemicals' estimated fair value is ₹194 based on 2 Stage Free Cash Flow to Equity
- Current share price of ₹253 suggests Mangalore Refinery and Petrochemicals is potentially 30% overvalued
- Analyst price target for MRPL is ₹110 which is 43% below our fair value estimate
In this article we are going to estimate the intrinsic value of Mangalore Refinery and Petrochemicals Limited (NSE:MRPL) by taking the expected future cash flows and discounting them to today's value. We will take advantage of the Discounted Cash Flow (DCF) model for this purpose. Models like these may appear beyond the comprehension of a lay person, but they're fairly easy to follow.
Companies can be valued in a lot of ways, so we would point out that a DCF is not perfect for every situation. For those who are keen learners of equity analysis, the Simply Wall St analysis model here may be something of interest to you.
View our latest analysis for Mangalore Refinery and Petrochemicals
The Calculation
We use what is known as a 2-stage model, which simply means we have two different periods of growth rates for the company's cash flows. Generally the first stage is higher growth, and the second stage is a lower growth phase. To start off with, we need to estimate the next ten years of cash flows. Where possible we use analyst estimates, but when these aren't available we extrapolate the previous free cash flow (FCF) from the last estimate or reported value. We assume companies with shrinking free cash flow will slow their rate of shrinkage, and that companies with growing free cash flow will see their growth rate slow, over this period. We do this to reflect that growth tends to slow more in the early years than it does in later years.
Generally we assume that a dollar today is more valuable than a dollar in the future, and so the sum of these future cash flows is then discounted to today's value:
10-year free cash flow (FCF) forecast
| 2024 | 2025 | 2026 | 2027 | 2028 | 2029 | 2030 | 2031 | 2032 | 2033 | |
| Levered FCF (₹, Millions) | ₹49.2b | ₹42.8b | ₹41.6b | ₹41.6b | ₹42.5b | ₹44.0b | ₹46.0b | ₹48.3b | ₹51.0b | ₹54.1b |
| Growth Rate Estimate Source | Analyst x2 | Analyst x3 | Analyst x2 | Est @ 0.17% | Est @ 2.13% | Est @ 3.51% | Est @ 4.47% | Est @ 5.14% | Est @ 5.61% | Est @ 5.94% |
| Present Value (₹, Millions) Discounted @ 17% | ₹42.2k | ₹31.5k | ₹26.2k | ₹22.5k | ₹19.7k | ₹17.5k | ₹15.7k | ₹14.2k | ₹12.8k | ₹11.7k |
("Est" = FCF growth rate estimated by Simply Wall St)
Present Value of 10-year Cash Flow (PVCF) = ₹214b
We now need to calculate the Terminal Value, which accounts for all the future cash flows after this ten year period. For a number of reasons a very conservative growth rate is used that cannot exceed that of a country's GDP growth. In this case we have used the 5-year average of the 10-year government bond yield (6.7%) to estimate future growth. In the same way as with the 10-year 'growth' period, we discount future cash flows to today's value, using a cost of equity of 17%.
Terminal Value (TV)= FCF2033 × (1 + g) ÷ (r – g) = ₹54b× (1 + 6.7%) ÷ (17%– 6.7%) = ₹584b
Present Value of Terminal Value (PVTV)= TV / (1 + r)10= ₹584b÷ ( 1 + 17%)10= ₹126b
The total value is the sum of cash flows for the next ten years plus the discounted terminal value, which results in the Total Equity Value, which in this case is ₹340b. The last step is to then divide the equity value by the number of shares outstanding. Compared to the current share price of ₹253, the company appears potentially overvalued at the time of writing. Remember though, that this is just an approximate valuation, and like any complex formula - garbage in, garbage out.
Important Assumptions
Now the most important inputs to a discounted cash flow are the discount rate, and of course, the actual cash flows. Part of investing is coming up with your own evaluation of a company's future performance, so try the calculation yourself and check your own assumptions. The DCF also does not consider the possible cyclicality of an industry, or a company's future capital requirements, so it does not give a full picture of a company's potential performance. Given that we are looking at Mangalore Refinery and Petrochemicals as potential shareholders, the cost of equity is used as the discount rate, rather than the cost of capital (or weighted average cost of capital, WACC) which accounts for debt. In this calculation we've used 17%, which is based on a levered beta of 1.265. Beta is a measure of a stock's volatility, compared to the market as a whole. We get our beta from the industry average beta of globally comparable companies, with an imposed limit between 0.8 and 2.0, which is a reasonable range for a stable business.
SWOT Analysis for Mangalore Refinery and Petrochemicals
- Earnings growth over the past year exceeded the industry.
- Debt is well covered by earnings and cashflows.
- Earnings growth over the past year is below its 5-year average.
- Dividend is low compared to the top 25% of dividend payers in the Oil and Gas market.
- Expensive based on P/E ratio and estimated fair value.
- MRPL's financial characteristics indicate limited near-term opportunities for shareholders.
- Annual earnings are forecast to decline for the next 3 years.
Next Steps:
Valuation is only one side of the coin in terms of building your investment thesis, and it is only one of many factors that you need to assess for a company. The DCF model is not a perfect stock valuation tool. Preferably you'd apply different cases and assumptions and see how they would impact the company's valuation. For instance, if the terminal value growth rate is adjusted slightly, it can dramatically alter the overall result. Can we work out why the company is trading at a premium to intrinsic value? For Mangalore Refinery and Petrochemicals, we've compiled three further aspects you should assess:
- Risks: Take risks, for example - Mangalore Refinery and Petrochemicals has 4 warning signs (and 2 which are potentially serious) we think you should know about.
- Future Earnings: How does MRPL's growth rate compare to its peers and the wider market? Dig deeper into the analyst consensus number for the upcoming years by interacting with our free analyst growth expectation chart.
- Other Solid Businesses: Low debt, high returns on equity and good past performance are fundamental to a strong business. Why not explore our interactive list of stocks with solid business fundamentals to see if there are other companies you may not have considered!
PS. Simply Wall St updates its DCF calculation for every Indian stock every day, so if you want to find the intrinsic value of any other stock just search here.
New: Manage All Your Stock Portfolios in One Place
We've created the ultimate portfolio companion for stock investors, and it's free.
• Connect an unlimited number of Portfolios and see your total in one currency
• Be alerted to new Warning Signs or Risks via email or mobile
• Track the Fair Value of your stocks
Have feedback on this article? Concerned about the content? Get in touch with us directly. Alternatively, email editorial-team (at) simplywallst.com.
This article by Simply Wall St is general in nature. We provide commentary based on historical data and analyst forecasts only using an unbiased methodology and our articles are not intended to be financial advice. It does not constitute a recommendation to buy or sell any stock, and does not take account of your objectives, or your financial situation. We aim to bring you long-term focused analysis driven by fundamental data. Note that our analysis may not factor in the latest price-sensitive company announcements or qualitative material. Simply Wall St has no position in any stocks mentioned.
About NSEI:MRPL
Mangalore Refinery and Petrochemicals
Engages in the manufacture and sale of refined petroleum products in India and internationally.
Average dividend payer with moderate growth potential.
Similar Companies
Market Insights

Community Narratives


