Stock Analysis
- India
- /
- Diversified Financial
- /
- NSEI:TFCILTD
Tourism Finance Corporation of India (NSE:TFCILTD) jumps 12% this week, though earnings growth is still tracking behind three-year shareholder returns

The worst result, after buying shares in a company (assuming no leverage), would be if you lose all the money you put in. But in contrast you can make much more than 100% if the company does well. For example, the Tourism Finance Corporation of India Limited (NSE:TFCILTD) share price has soared 131% in the last three years. How nice for those who held the stock! It's also good to see the share price up 39% over the last quarter. This could be related to the recent financial results, released recently - you can catch up on the most recent data by reading our company report.
On the back of a solid 7-day performance, let's check what role the company's fundamentals have played in driving long term shareholder returns.
See our latest analysis for Tourism Finance Corporation of India
While markets are a powerful pricing mechanism, share prices reflect investor sentiment, not just underlying business performance. One way to examine how market sentiment has changed over time is to look at the interaction between a company's share price and its earnings per share (EPS).
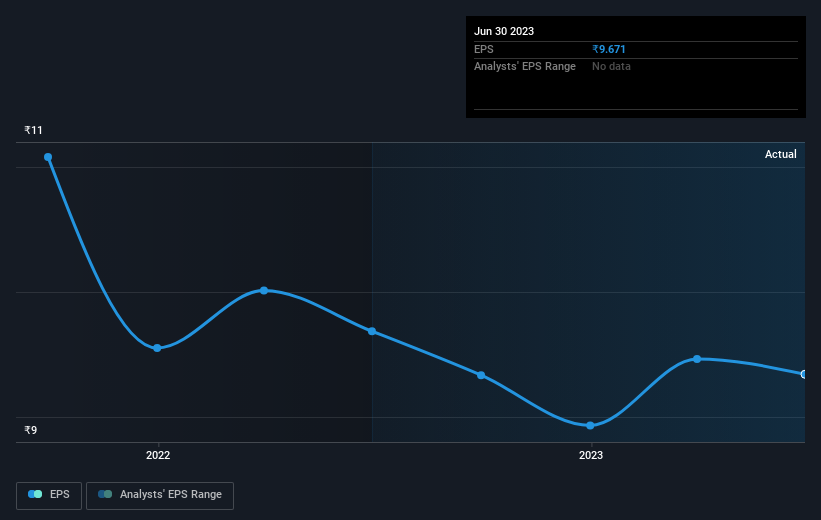
Tourism Finance Corporation of India was able to grow its EPS at 1.5% per year over three years, sending the share price higher. This EPS growth is lower than the 32% average annual increase in the share price. So it's fair to assume the market has a higher opinion of the business than it did three years ago. It is quite common to see investors become enamoured with a business, after a few years of solid progress.
You can see how EPS has changed over time in the image below (click on the chart to see the exact values).
We consider it positive that insiders have made significant purchases in the last year. Having said that, most people consider earnings and revenue growth trends to be a more meaningful guide to the business. Before buying or selling a stock, we always recommend a close examination of historic growth trends, available here..
What About Dividends?
As well as measuring the share price return, investors should also consider the total shareholder return (TSR). The TSR incorporates the value of any spin-offs or discounted capital raisings, along with any dividends, based on the assumption that the dividends are reinvested. Arguably, the TSR gives a more comprehensive picture of the return generated by a stock. In the case of Tourism Finance Corporation of India, it has a TSR of 144% for the last 3 years. That exceeds its share price return that we previously mentioned. This is largely a result of its dividend payments!
A Different Perspective
It's nice to see that Tourism Finance Corporation of India shareholders have received a total shareholder return of 79% over the last year. Of course, that includes the dividend. That certainly beats the loss of about 5% per year over the last half decade. The long term loss makes us cautious, but the short term TSR gain certainly hints at a brighter future. While it is well worth considering the different impacts that market conditions can have on the share price, there are other factors that are even more important. Take risks, for example - Tourism Finance Corporation of India has 2 warning signs (and 1 which makes us a bit uncomfortable) we think you should know about.
There are plenty of other companies that have insiders buying up shares. You probably do not want to miss this free list of growing companies that insiders are buying.
Please note, the market returns quoted in this article reflect the market weighted average returns of stocks that currently trade on Indian exchanges.
Valuation is complex, but we're helping make it simple.
Find out whether Tourism Finance Corporation of India is potentially over or undervalued by checking out our comprehensive analysis, which includes fair value estimates, risks and warnings, dividends, insider transactions and financial health.
View the Free AnalysisHave feedback on this article? Concerned about the content? Get in touch with us directly. Alternatively, email editorial-team (at) simplywallst.com.
This article by Simply Wall St is general in nature. We provide commentary based on historical data and analyst forecasts only using an unbiased methodology and our articles are not intended to be financial advice. It does not constitute a recommendation to buy or sell any stock, and does not take account of your objectives, or your financial situation. We aim to bring you long-term focused analysis driven by fundamental data. Note that our analysis may not factor in the latest price-sensitive company announcements or qualitative material. Simply Wall St has no position in any stocks mentioned.
About NSEI:TFCILTD
Tourism Finance Corporation of India
Tourism Finance Corporation of India Limited engages in the provision of financial assistance to tourism, social infrastructure, manufacturing, and other resilient sectors in India.
Established dividend payer with proven track record.

