
Advertisement
- India
- /
- Capital Markets
- /
- NSEI:MCX
Multi Commodity Exchange of India Full Year 2025 Earnings: Revenues Beat Expectations, EPS Lags

Multi Commodity Exchange of India (NSE:MCX) Full Year 2025 Results
Key Financial Results
- Revenue: ₹12.1b (up 61% from FY 2024).
- Net income: ₹5.60b (up by ₹4.77b from FY 2024).
- Profit margin: 46% (up from 11% in FY 2024). The increase in margin was primarily driven by higher revenue.
- EPS: ₹110 (up from ₹16.30 in FY 2024).
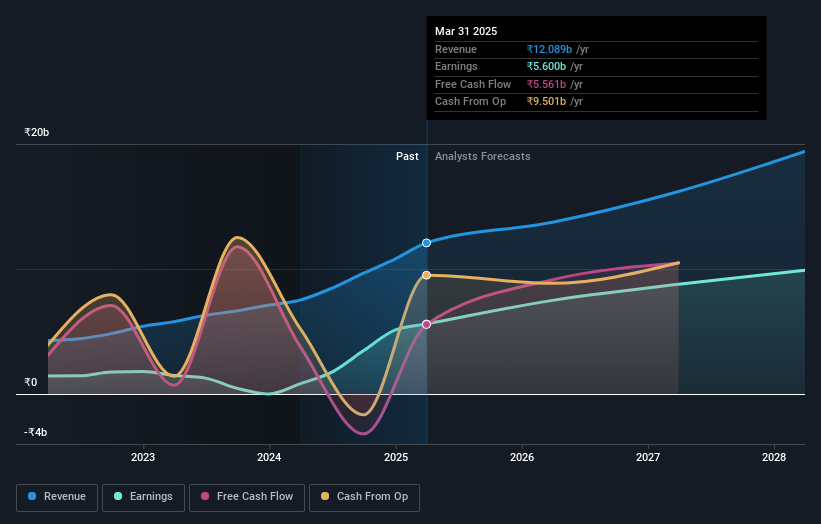
All figures shown in the chart above are for the trailing 12 month (TTM) period
Multi Commodity Exchange of India Revenues Beat Expectations, EPS Falls Short
Revenue exceeded analyst estimates by 1.3%. Earnings per share (EPS) missed analyst estimates by 2.3%.
Looking ahead, revenue is forecast to grow 14% p.a. on average during the next 3 years, compared to a 13% growth forecast for the Capital Markets industry in India.
Performance of the Indian Capital Markets industry.
The company's shares are down 9.5% from a week ago.
Balance Sheet Analysis
While earnings are important, another area to consider is the balance sheet. We have a graphic representation of Multi Commodity Exchange of India's balance sheet and an in-depth analysis of the company's financial position.
New: Manage All Your Stock Portfolios in One Place
We've created the ultimate portfolio companion for stock investors, and it's free.
• Connect an unlimited number of Portfolios and see your total in one currency
• Be alerted to new Warning Signs or Risks via email or mobile
• Track the Fair Value of your stocks
Have feedback on this article? Concerned about the content? Get in touch with us directly. Alternatively, email editorial-team (at) simplywallst.com.
This article by Simply Wall St is general in nature. We provide commentary based on historical data and analyst forecasts only using an unbiased methodology and our articles are not intended to be financial advice. It does not constitute a recommendation to buy or sell any stock, and does not take account of your objectives, or your financial situation. We aim to bring you long-term focused analysis driven by fundamental data. Note that our analysis may not factor in the latest price-sensitive company announcements or qualitative material. Simply Wall St has no position in any stocks mentioned.
About NSEI:MCX
Multi Commodity Exchange of India
A commodity derivatives exchange, provides a platform to facilitate online trading of commodity derivatives in India.
Flawless balance sheet with solid track record and pays a dividend.
Similar Companies
Market Insights


Advertisement
Community Narratives
The Future of Drug Testing? Fingerprint Tech Shows Serious Promise
Fair Value US$2.98|40.3% undervalued
JO
Community Contributor
Suncorp’s Next Chapter: Insurance-Only and Ready to Grow
Fair Value AU$22.83|7.9% undervalued
RO
Community Contributor
Thyssenkrupp Nucera Will Achieve Double-Digit Profits by 2030 Boosted by Hydrogen Growth
Fair Value €14.40|31.6% undervalued
CH
Community Contributor
Tesla’s Nvidia Moment – The AI & Robotics Inflection Point
Fair Value US$359.72|12.3% undervalued
BL
Community Contributor