- India
- /
- Capital Markets
- /
- NSEI:AVONMORE
Avonmore Capital & Management Services Limited's (NSE:AVONMORE) Price Is Right But Growth Is Lacking After Shares Rocket 37%


Avonmore Capital & Management Services Limited (NSE:AVONMORE) shares have continued their recent momentum with a 37% gain in the last month alone. Looking back a bit further, it's encouraging to see the stock is up 46% in the last year.
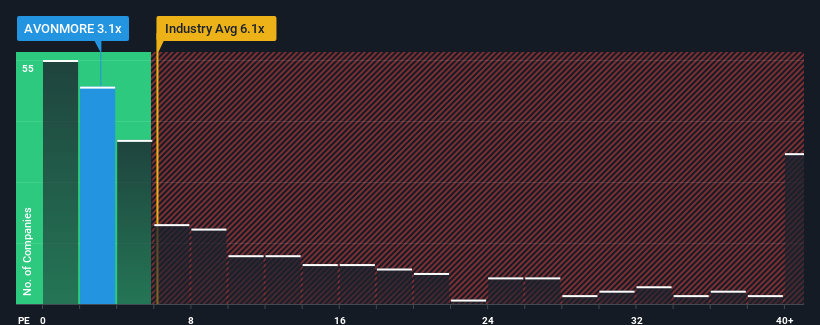
In spite of the firm bounce in price, Avonmore Capital & Management Services may still be sending buy signals at present with its price-to-sales (or "P/S") ratio of 3.1x, considering almost half of all companies in the Capital Markets industry in India have P/S ratios greater than 6.1x and even P/S higher than 19x aren't out of the ordinary. However, the P/S might be low for a reason and it requires further investigation to determine if it's justified.
See our latest analysis for Avonmore Capital & Management Services
What Does Avonmore Capital & Management Services' Recent Performance Look Like?
For example, consider that Avonmore Capital & Management Services' financial performance has been poor lately as its revenue has been in decline. It might be that many expect the disappointing revenue performance to continue or accelerate, which has repressed the P/S. Those who are bullish on Avonmore Capital & Management Services will be hoping that this isn't the case so that they can pick up the stock at a lower valuation.
Although there are no analyst estimates available for Avonmore Capital & Management Services, take a look at this free data-rich visualisation to see how the company stacks up on earnings, revenue and cash flow.How Is Avonmore Capital & Management Services' Revenue Growth Trending?
Avonmore Capital & Management Services' P/S ratio would be typical for a company that's only expected to deliver limited growth, and importantly, perform worse than the industry.
Retrospectively, the last year delivered a frustrating 58% decrease to the company's top line. Still, the latest three year period has seen an excellent 53% overall rise in revenue, in spite of its unsatisfying short-term performance. So we can start by confirming that the company has generally done a very good job of growing revenue over that time, even though it had some hiccups along the way.
Comparing the recent medium-term revenue trends against the industry's one-year growth forecast of 17% shows it's noticeably less attractive.
With this information, we can see why Avonmore Capital & Management Services is trading at a P/S lower than the industry. It seems most investors are expecting to see the recent limited growth rates continue into the future and are only willing to pay a reduced amount for the stock.
The Key Takeaway
The latest share price surge wasn't enough to lift Avonmore Capital & Management Services' P/S close to the industry median. It's argued the price-to-sales ratio is an inferior measure of value within certain industries, but it can be a powerful business sentiment indicator.
In line with expectations, Avonmore Capital & Management Services maintains its low P/S on the weakness of its recent three-year growth being lower than the wider industry forecast. At this stage investors feel the potential for an improvement in revenue isn't great enough to justify a higher P/S ratio. If recent medium-term revenue trends continue, it's hard to see the share price experience a reversal of fortunes anytime soon.
We don't want to rain on the parade too much, but we did also find 3 warning signs for Avonmore Capital & Management Services that you need to be mindful of.
If you're unsure about the strength of Avonmore Capital & Management Services' business, why not explore our interactive list of stocks with solid business fundamentals for some other companies you may have missed.
New: Manage All Your Stock Portfolios in One Place
We've created the ultimate portfolio companion for stock investors, and it's free.
• Connect an unlimited number of Portfolios and see your total in one currency
• Be alerted to new Warning Signs or Risks via email or mobile
• Track the Fair Value of your stocks
Have feedback on this article? Concerned about the content? Get in touch with us directly. Alternatively, email editorial-team (at) simplywallst.com.
This article by Simply Wall St is general in nature. We provide commentary based on historical data and analyst forecasts only using an unbiased methodology and our articles are not intended to be financial advice. It does not constitute a recommendation to buy or sell any stock, and does not take account of your objectives, or your financial situation. We aim to bring you long-term focused analysis driven by fundamental data. Note that our analysis may not factor in the latest price-sensitive company announcements or qualitative material. Simply Wall St has no position in any stocks mentioned.
About NSEI:AVONMORE
Avonmore Capital & Management Services
Provides non-banking financial and sub-broker advisory services in India.
Solid track record with excellent balance sheet.
Market Insights

Community Narratives

