
Advertisement
What Is Talwalkars Better Value Fitness's (NSE:TALWALKARS) P/E Ratio After Its Share Price Tanked?

Want to participate in a short research study? Help shape the future of investing tools and you could win a $250 gift card!
To the annoyance of some shareholders, Talwalkars Better Value Fitness (NSE:TALWALKARS) shares are down a considerable 37% in the last month. The recent drop has obliterated the annual return, with the share price now down 11% over that longer period.
Assuming nothing else has changed, a lower share price makes a stock more attractive to potential buyers. In the long term, share prices tend to follow earnings per share, but in the short term prices bounce around in response to short term factors (which are not always obvious). So, on certain occasions, long term focussed investors try to take advantage of pessimistic expectations to buy shares at a better price. Perhaps the simplest way to get a read on investors' expectations of a business is to look at its Price to Earnings Ratio (PE Ratio). A high P/E ratio means that investors have a high expectation about future growth, while a low P/E ratio means they have low expectations about future growth.
See our latest analysis for Talwalkars Better Value Fitness
Does Talwalkars Better Value Fitness Have A Relatively High Or Low P/E For Its Industry?
Talwalkars Better Value Fitness's P/E of 7.46 indicates relatively low sentiment towards the stock. We can see in the image below that the average P/E (21.5) for companies in the hospitality industry is higher than Talwalkars Better Value Fitness's P/E.
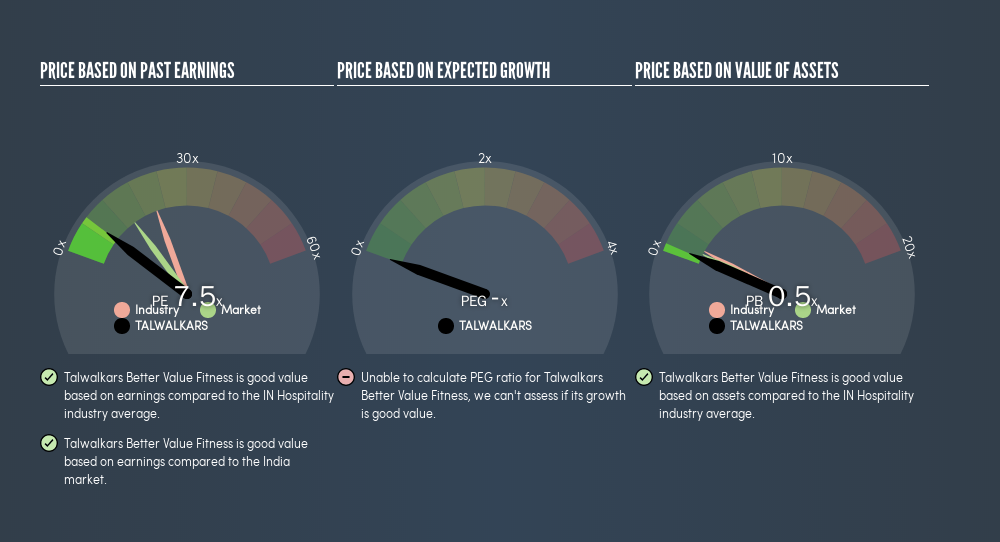
Talwalkars Better Value Fitness's P/E tells us that market participants think it will not fare as well as its peers in the same industry.
How Growth Rates Impact P/E Ratios
If earnings fall then in the future the 'E' will be lower. That means even if the current P/E is low, it will increase over time if the share price stays flat. A higher P/E should indicate the stock is expensive relative to others -- and that may encourage shareholders to sell.
Talwalkars Better Value Fitness's earnings made like a rocket, taking off 81% last year. Unfortunately, earnings per share are down 18% a year, over 5 years.
A Limitation: P/E Ratios Ignore Debt and Cash In The Bank
It's important to note that the P/E ratio considers the market capitalization, not the enterprise value. So it won't reflect the advantage of cash, or disadvantage of debt. In theory, a company can lower its future P/E ratio by using cash or debt to invest in growth.
While growth expenditure doesn't always pay off, the point is that it is a good option to have; but one that the P/E ratio ignores.
How Does Talwalkars Better Value Fitness's Debt Impact Its P/E Ratio?
Talwalkars Better Value Fitness's net debt is considerable, at 257% of its market cap. This level of debt justifies a relatively low P/E, so remain cognizant of the debt, if you're comparing it to other stocks.
The Bottom Line On Talwalkars Better Value Fitness's P/E Ratio
Talwalkars Better Value Fitness's P/E is 7.5 which is below average (14.5) in the IN market. The company may have significant debt, but EPS growth was good last year. If it continues to grow, then the current low P/E may prove to be unjustified. Given Talwalkars Better Value Fitness's P/E ratio has declined from 11.8 to 7.5 in the last month, we know for sure that the market is more worried about the business today, than it was back then. For those who prefer to invest with the flow of momentum, that might be a bad sign, but for deep value investors this stock might justify some research.
Investors should be looking to buy stocks that the market is wrong about. If the reality for a company is not as bad as the P/E ratio indicates, then the share price should increase as the market realizes this. Although we don't have analyst forecasts, you might want to assess this data-rich visualization of earnings, revenue and cash flow.
But note: Talwalkars Better Value Fitness may not be the best stock to buy. So take a peek at this free list of interesting companies with strong recent earnings growth (and a P/E ratio below 20).
We aim to bring you long-term focused research analysis driven by fundamental data. Note that our analysis may not factor in the latest price-sensitive company announcements or qualitative material.
If you spot an error that warrants correction, please contact the editor at editorial-team@simplywallst.com. This article by Simply Wall St is general in nature. It does not constitute a recommendation to buy or sell any stock, and does not take account of your objectives, or your financial situation. Simply Wall St has no position in the stocks mentioned. Thank you for reading.
Market Insights


Advertisement
Community Narratives
For the Emperor: Why Games Workshop Could Be a Star Investment
Fair Value UK£160.00|0.4% overvalued
RO
Community Contributor
Securitas will boost margins with AI and tech-driven services
Fair Value SEK 260.91|44.5% undervalued
UN
Community Contributor
A Leader in EV Charging with Growth Potential
Fair Value €27.00|17.8% undervalued
TI
Community Contributor