
Advertisement
- India
- /
- Food and Staples Retail
- /
- NSEI:SAKUMA
Here's What's Concerning About Sakuma Exports' (NSE:SAKUMA) Returns On Capital
If you're not sure where to start when looking for the next multi-bagger, there are a few key trends you should keep an eye out for. Firstly, we'll want to see a proven return on capital employed (ROCE) that is increasing, and secondly, an expanding base of capital employed. Ultimately, this demonstrates that it's a business that is reinvesting profits at increasing rates of return. In light of that, when we looked at Sakuma Exports (NSE:SAKUMA) and its ROCE trend, we weren't exactly thrilled.
Understanding Return On Capital Employed (ROCE)
Just to clarify if you're unsure, ROCE is a metric for evaluating how much pre-tax income (in percentage terms) a company earns on the capital invested in its business. The formula for this calculation on Sakuma Exports is:
Return on Capital Employed = Earnings Before Interest and Tax (EBIT) ÷ (Total Assets - Current Liabilities)
0.037 = ₹137m ÷ (₹4.3b - ₹544m) (Based on the trailing twelve months to March 2021).
Therefore, Sakuma Exports has an ROCE of 3.7%. In absolute terms, that's a low return and it also under-performs the Consumer Retailing industry average of 8.9%.
View our latest analysis for Sakuma Exports
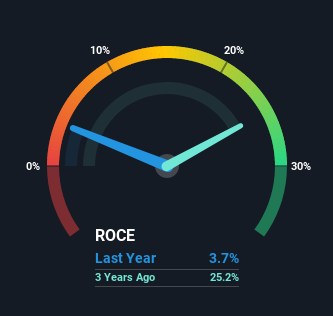
Historical performance is a great place to start when researching a stock so above you can see the gauge for Sakuma Exports' ROCE against it's prior returns. If you'd like to look at how Sakuma Exports has performed in the past in other metrics, you can view this free graph of past earnings, revenue and cash flow.
What Does the ROCE Trend For Sakuma Exports Tell Us?
We weren't thrilled with the trend because Sakuma Exports' ROCE has reduced by 87% over the last five years, while the business employed 174% more capital. That being said, Sakuma Exports raised some capital prior to their latest results being released, so that could partly explain the increase in capital employed. Sakuma Exports probably hasn't received a full year of earnings yet from the new funds it raised, so these figures should be taken with a grain of salt.
On a related note, Sakuma Exports has decreased its current liabilities to 13% of total assets. Considering it used to be 82%, that's a huge drop in that ratio and it would explain the decline in ROCE. Effectively this means their suppliers or short-term creditors are funding less of the business, which reduces some elements of risk. Some would claim this reduces the business' efficiency at generating ROCE since it is now funding more of the operations with its own money.
The Bottom Line
From the above analysis, we find it rather worrisome that returns on capital and sales for Sakuma Exports have fallen, meanwhile the business is employing more capital than it was five years ago. However the stock has delivered a 86% return to shareholders over the last five years, so investors might be expecting the trends to turn around. Regardless, we don't feel too comfortable with the fundamentals so we'd be steering clear of this stock for now.
Since virtually every company faces some risks, it's worth knowing what they are, and we've spotted 6 warning signs for Sakuma Exports (of which 2 make us uncomfortable!) that you should know about.
If you want to search for solid companies with great earnings, check out this free list of companies with good balance sheets and impressive returns on equity.
If you’re looking to trade Sakuma Exports, open an account with the lowest-cost* platform trusted by professionals, Interactive Brokers. Their clients from over 200 countries and territories trade stocks, options, futures, forex, bonds and funds worldwide from a single integrated account. Promoted
New: Manage All Your Stock Portfolios in One Place
We've created the ultimate portfolio companion for stock investors, and it's free.
• Connect an unlimited number of Portfolios and see your total in one currency
• Be alerted to new Warning Signs or Risks via email or mobile
• Track the Fair Value of your stocks
This article by Simply Wall St is general in nature. It does not constitute a recommendation to buy or sell any stock, and does not take account of your objectives, or your financial situation. We aim to bring you long-term focused analysis driven by fundamental data. Note that our analysis may not factor in the latest price-sensitive company announcements or qualitative material. Simply Wall St has no position in any stocks mentioned.
*Interactive Brokers Rated Lowest Cost Broker by StockBrokers.com Annual Online Review 2020
Have feedback on this article? Concerned about the content? Get in touch with us directly. Alternatively, email editorial-team (at) simplywallst.com.
About NSEI:SAKUMA
Excellent balance sheet with low risk.
Similar Companies
Market Insights

Advertisement
Community Narratives
MicroVision will explode future revenue by 380.37% with a vision towards success
Fair Value US$60|98.4% undervalued
TH
Community Contributor
The Indispensable Artery for a New North American Economy
Fair Value CA$132.87|0.7% overvalued
TI
Community Contributor
Recently Updated Narratives
CO

composite32 on Astor Enerji ·
Astor Enerji will surge with a fair value of $140.43 in the next 3 years
Fair Value:₺140.4335.5% undervalued
1 followerusers have followed this narrative
0 commentsusers have commented on this narrative
0 likesusers have liked this narrative
RE

RecMag on Proximus ·
Proximus: The State-Backed Backup Plan with 7% Gross Yield and 15% Currency Upside.
Fair Value:€17.1356.7% undervalued
30 followersusers have followed this narrative
0 commentsusers have commented on this narrative
0 likesusers have liked this narrative
AG


Agricola on IMPACT Silver ·
A case for for IMPACT Silver Corp (TSXV:IPT) to reach USD $4.52 (CAD $6.16) in 2026 (23 bagger in 1 year) and USD $5.76 (CAD $7.89) by 2030
Fair Value:CA$7.8996.2% undervalued
1 followerusers have followed this narrative
0 commentsusers have commented on this narrative
0 likesusers have liked this narrative
Popular Narratives
TH

TheWallstreetKing on MicroVision ·
MicroVision will explode future revenue by 380.37% with a vision towards success
Fair Value:US$6098.4% undervalued
101 followersusers have followed this narrative
10 commentsusers have commented on this narrative
20 likesusers have liked this narrative
AN


AnalystConsensusTarget on NVIDIA ·
NVDA: Expanding AI Demand Will Drive Major Data Center Investments Through 2026
Fair Value:US$250.3929.3% undervalued
932 followersusers have followed this narrative
6 commentsusers have commented on this narrative
23 likesusers have liked this narrative
OS


oscargarcia on Alphabet ·
The company that turned a verb into a global necessity and basically runs the modern internet, digital ads, smartphones, maps, and AI.
Fair Value:US$3405.8% undervalued
139 followersusers have followed this narrative
6 commentsusers have commented on this narrative
18 likesusers have liked this narrative