Zodiac Clothing Company Limited's (NSE:ZODIACLOTH) 25% Share Price Plunge Could Signal Some Risk


Zodiac Clothing Company Limited (NSE:ZODIACLOTH) shareholders that were waiting for something to happen have been dealt a blow with a 25% share price drop in the last month. Instead of being rewarded, shareholders who have already held through the last twelve months are now sitting on a 32% share price drop.
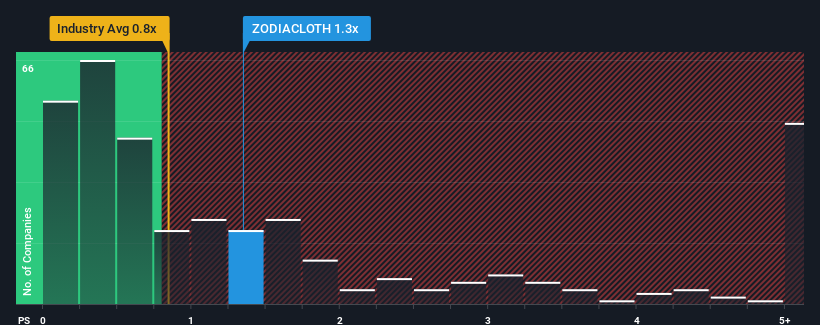
Even after such a large drop in price, you could still be forgiven for thinking Zodiac Clothing is a stock not worth researching with a price-to-sales ratios (or "P/S") of 1.3x, considering almost half the companies in India's Luxury industry have P/S ratios below 0.8x. Although, it's not wise to just take the P/S at face value as there may be an explanation why it's as high as it is.
See our latest analysis for Zodiac Clothing
What Does Zodiac Clothing's P/S Mean For Shareholders?
Zodiac Clothing has been doing a good job lately as it's been growing revenue at a solid pace. One possibility is that the P/S ratio is high because investors think this respectable revenue growth will be enough to outperform the broader industry in the near future. You'd really hope so, otherwise you're paying a pretty hefty price for no particular reason.
Want the full picture on earnings, revenue and cash flow for the company? Then our free report on Zodiac Clothing will help you shine a light on its historical performance.What Are Revenue Growth Metrics Telling Us About The High P/S?
In order to justify its P/S ratio, Zodiac Clothing would need to produce impressive growth in excess of the industry.
Taking a look back first, we see that the company grew revenue by an impressive 19% last year. Pleasingly, revenue has also lifted 40% in aggregate from three years ago, thanks to the last 12 months of growth. Accordingly, shareholders would have definitely welcomed those medium-term rates of revenue growth.
Comparing that to the industry, which is predicted to deliver 87% growth in the next 12 months, the company's momentum is weaker, based on recent medium-term annualised revenue results.
In light of this, it's alarming that Zodiac Clothing's P/S sits above the majority of other companies. It seems most investors are ignoring the fairly limited recent growth rates and are hoping for a turnaround in the company's business prospects. There's a good chance existing shareholders are setting themselves up for future disappointment if the P/S falls to levels more in line with recent growth rates.
What We Can Learn From Zodiac Clothing's P/S?
There's still some elevation in Zodiac Clothing's P/S, even if the same can't be said for its share price recently. Typically, we'd caution against reading too much into price-to-sales ratios when settling on investment decisions, though it can reveal plenty about what other market participants think about the company.
The fact that Zodiac Clothing currently trades on a higher P/S relative to the industry is an oddity, since its recent three-year growth is lower than the wider industry forecast. Right now we aren't comfortable with the high P/S as this revenue performance isn't likely to support such positive sentiment for long. Unless the recent medium-term conditions improve markedly, it's very challenging to accept these the share price as being reasonable.
You should always think about risks. Case in point, we've spotted 2 warning signs for Zodiac Clothing you should be aware of, and 1 of them is significant.
If you're unsure about the strength of Zodiac Clothing's business, why not explore our interactive list of stocks with solid business fundamentals for some other companies you may have missed.
If you're looking to trade Zodiac Clothing, open an account with the lowest-cost platform trusted by professionals, Interactive Brokers.
With clients in over 200 countries and territories, and access to 160 markets, IBKR lets you trade stocks, options, futures, forex, bonds and funds from a single integrated account.
Enjoy no hidden fees, no account minimums, and FX conversion rates as low as 0.03%, far better than what most brokers offer.
Sponsored ContentValuation is complex, but we're here to simplify it.
Discover if Zodiac Clothing might be undervalued or overvalued with our detailed analysis, featuring fair value estimates, potential risks, dividends, insider trades, and its financial condition.
Access Free AnalysisHave feedback on this article? Concerned about the content? Get in touch with us directly. Alternatively, email editorial-team (at) simplywallst.com.
This article by Simply Wall St is general in nature. We provide commentary based on historical data and analyst forecasts only using an unbiased methodology and our articles are not intended to be financial advice. It does not constitute a recommendation to buy or sell any stock, and does not take account of your objectives, or your financial situation. We aim to bring you long-term focused analysis driven by fundamental data. Note that our analysis may not factor in the latest price-sensitive company announcements or qualitative material. Simply Wall St has no position in any stocks mentioned.
About NSEI:ZODIACLOTH
Zodiac Clothing
Manufactures, retails, and trades men’s clothing and accessories in India and internationally.
Adequate balance sheet low.
Market Insights

Community Narratives

