Veekayem Fashion And Apparels Limited (NSE:VEEKAYEM) Soars 29% But It's A Story Of Risk Vs Reward


Veekayem Fashion And Apparels Limited (NSE:VEEKAYEM) shareholders would be excited to see that the share price has had a great month, posting a 29% gain and recovering from prior weakness. The last month tops off a massive increase of 257% in the last year.
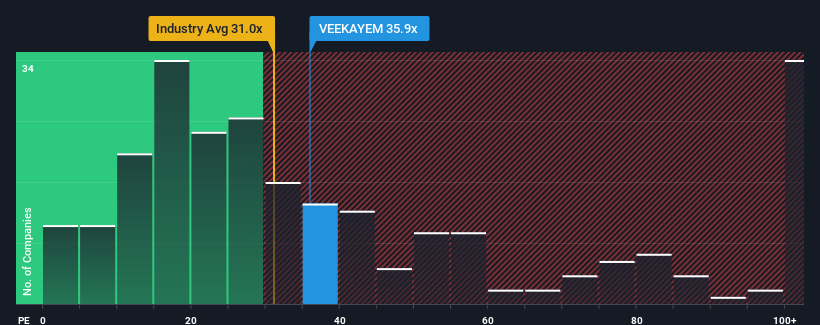
In spite of the firm bounce in price, you could still be forgiven for feeling indifferent about Veekayem Fashion And Apparels' P/E ratio of 35.9x, since the median price-to-earnings (or "P/E") ratio in India is also close to 34x. However, investors might be overlooking a clear opportunity or potential setback if there is no rational basis for the P/E.
Veekayem Fashion And Apparels has been doing a good job lately as it's been growing earnings at a solid pace. One possibility is that the P/E is moderate because investors think this respectable earnings growth might not be enough to outperform the broader market in the near future. If that doesn't eventuate, then existing shareholders probably aren't too pessimistic about the future direction of the share price.
Check out our latest analysis for Veekayem Fashion And Apparels
What Are Growth Metrics Telling Us About The P/E?
The only time you'd be comfortable seeing a P/E like Veekayem Fashion And Apparels' is when the company's growth is tracking the market closely.
If we review the last year of earnings growth, the company posted a terrific increase of 28%. The strong recent performance means it was also able to grow EPS by 734% in total over the last three years. So we can start by confirming that the company has done a great job of growing earnings over that time.
Weighing that recent medium-term earnings trajectory against the broader market's one-year forecast for expansion of 26% shows it's noticeably more attractive on an annualised basis.
In light of this, it's curious that Veekayem Fashion And Apparels' P/E sits in line with the majority of other companies. It may be that most investors are not convinced the company can maintain its recent growth rates.
The Final Word
Veekayem Fashion And Apparels appears to be back in favour with a solid price jump getting its P/E back in line with most other companies. Generally, our preference is to limit the use of the price-to-earnings ratio to establishing what the market thinks about the overall health of a company.
We've established that Veekayem Fashion And Apparels currently trades on a lower than expected P/E since its recent three-year growth is higher than the wider market forecast. There could be some unobserved threats to earnings preventing the P/E ratio from matching this positive performance. At least the risk of a price drop looks to be subdued if recent medium-term earnings trends continue, but investors seem to think future earnings could see some volatility.
We don't want to rain on the parade too much, but we did also find 2 warning signs for Veekayem Fashion And Apparels (1 doesn't sit too well with us!) that you need to be mindful of.
Of course, you might find a fantastic investment by looking at a few good candidates. So take a peek at this free list of companies with a strong growth track record, trading on a low P/E.
If you're looking to trade Veekayem Fashion and Apparels, open an account with the lowest-cost platform trusted by professionals, Interactive Brokers.
With clients in over 200 countries and territories, and access to 160 markets, IBKR lets you trade stocks, options, futures, forex, bonds and funds from a single integrated account.
Enjoy no hidden fees, no account minimums, and FX conversion rates as low as 0.03%, far better than what most brokers offer.
Sponsored ContentNew: Manage All Your Stock Portfolios in One Place
We've created the ultimate portfolio companion for stock investors, and it's free.
• Connect an unlimited number of Portfolios and see your total in one currency
• Be alerted to new Warning Signs or Risks via email or mobile
• Track the Fair Value of your stocks
Have feedback on this article? Concerned about the content? Get in touch with us directly. Alternatively, email editorial-team (at) simplywallst.com.
This article by Simply Wall St is general in nature. We provide commentary based on historical data and analyst forecasts only using an unbiased methodology and our articles are not intended to be financial advice. It does not constitute a recommendation to buy or sell any stock, and does not take account of your objectives, or your financial situation. We aim to bring you long-term focused analysis driven by fundamental data. Note that our analysis may not factor in the latest price-sensitive company announcements or qualitative material. Simply Wall St has no position in any stocks mentioned.
About NSEI:VEEKAYEM
Veekayem Fashion and Apparels
Engages in the garment manufacturing business in India and internationally.
Solid track record with mediocre balance sheet.
Similar Companies
Market Insights

Community Narratives

