
Advertisement
A Piece Of The Puzzle Missing From Veekayem Fashion and Apparels Limited's (NSE:VEEKAYEM) 26% Share Price Climb
Veekayem Fashion and Apparels Limited (NSE:VEEKAYEM) shares have had a really impressive month, gaining 26% after a shaky period beforehand. The last 30 days bring the annual gain to a very sharp 51%.
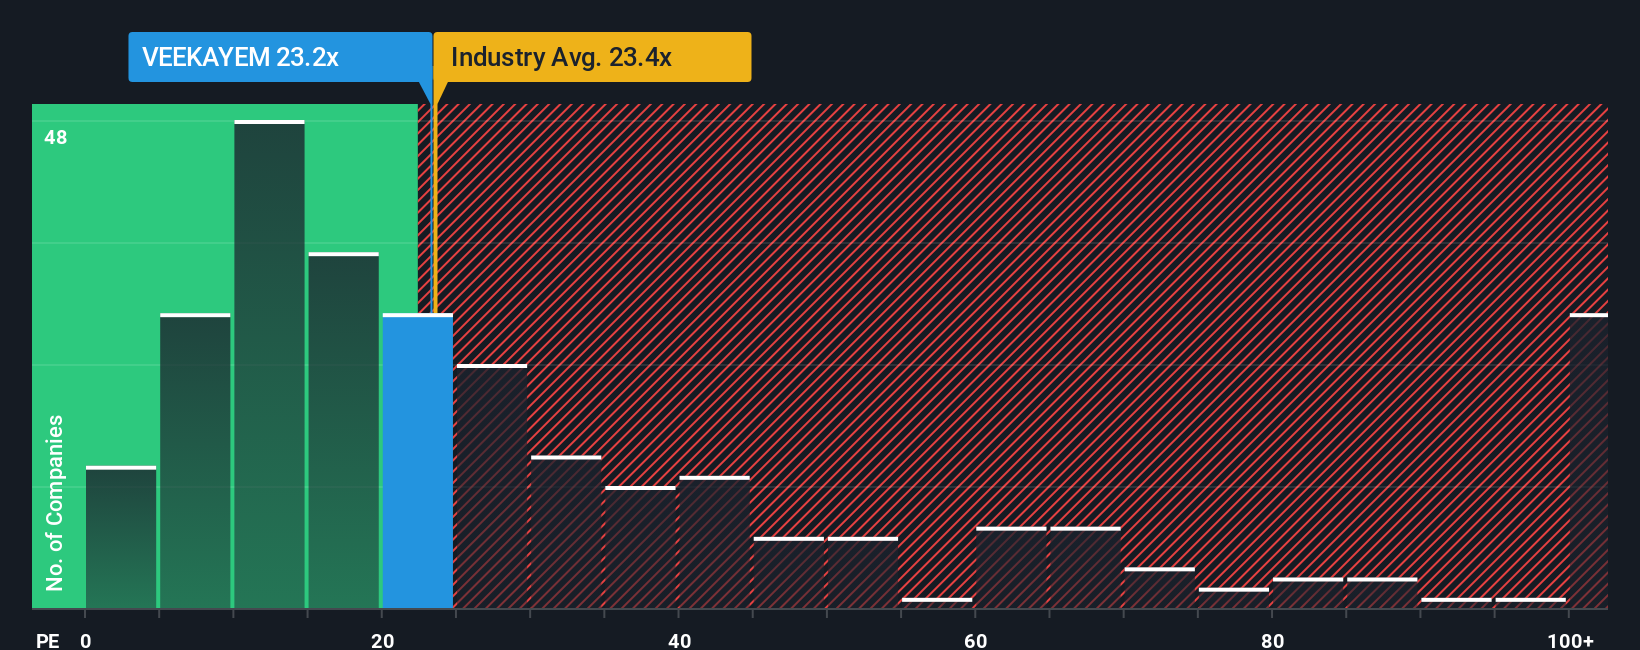
Even after such a large jump in price, Veekayem Fashion and Apparels' price-to-earnings (or "P/E") ratio of 23.2x might still make it look like a buy right now compared to the market in India, where around half of the companies have P/E ratios above 28x and even P/E's above 53x are quite common. Although, it's not wise to just take the P/E at face value as there may be an explanation why it's limited.
With earnings growth that's exceedingly strong of late, Veekayem Fashion and Apparels has been doing very well. It might be that many expect the strong earnings performance to degrade substantially, which has repressed the P/E. If that doesn't eventuate, then existing shareholders have reason to be quite optimistic about the future direction of the share price.
Check out our latest analysis for Veekayem Fashion and Apparels
How Is Veekayem Fashion and Apparels' Growth Trending?
Veekayem Fashion and Apparels' P/E ratio would be typical for a company that's only expected to deliver limited growth, and importantly, perform worse than the market.
If we review the last year of earnings growth, the company posted a terrific increase of 90%. The latest three year period has also seen an excellent 196% overall rise in EPS, aided by its short-term performance. So we can start by confirming that the company has done a great job of growing earnings over that time.
Comparing that to the market, which is only predicted to deliver 25% growth in the next 12 months, the company's momentum is stronger based on recent medium-term annualised earnings results.
With this information, we find it odd that Veekayem Fashion and Apparels is trading at a P/E lower than the market. Apparently some shareholders believe the recent performance has exceeded its limits and have been accepting significantly lower selling prices.
The Final Word
Veekayem Fashion and Apparels' stock might have been given a solid boost, but its P/E certainly hasn't reached any great heights. Using the price-to-earnings ratio alone to determine if you should sell your stock isn't sensible, however it can be a practical guide to the company's future prospects.
We've established that Veekayem Fashion and Apparels currently trades on a much lower than expected P/E since its recent three-year growth is higher than the wider market forecast. When we see strong earnings with faster-than-market growth, we assume potential risks are what might be placing significant pressure on the P/E ratio. It appears many are indeed anticipating earnings instability, because the persistence of these recent medium-term conditions would normally provide a boost to the share price.
Having said that, be aware Veekayem Fashion and Apparels is showing 2 warning signs in our investment analysis, and 1 of those makes us a bit uncomfortable.
Of course, you might find a fantastic investment by looking at a few good candidates. So take a peek at this free list of companies with a strong growth track record, trading on a low P/E.
New: Manage All Your Stock Portfolios in One Place
We've created the ultimate portfolio companion for stock investors, and it's free.
• Connect an unlimited number of Portfolios and see your total in one currency
• Be alerted to new Warning Signs or Risks via email or mobile
• Track the Fair Value of your stocks
Have feedback on this article? Concerned about the content? Get in touch with us directly. Alternatively, email editorial-team (at) simplywallst.com.
This article by Simply Wall St is general in nature. We provide commentary based on historical data and analyst forecasts only using an unbiased methodology and our articles are not intended to be financial advice. It does not constitute a recommendation to buy or sell any stock, and does not take account of your objectives, or your financial situation. We aim to bring you long-term focused analysis driven by fundamental data. Note that our analysis may not factor in the latest price-sensitive company announcements or qualitative material. Simply Wall St has no position in any stocks mentioned.
About NSEI:VEEKAYEM
Veekayem Fashion and Apparels
Engages in the garment manufacturing business in India and internationally.
Solid track record with mediocre balance sheet.
Similar Companies
Market Insights


Advertisement
Community Narratives
The Next Phase of Defense AI: A Robotic Response to America’s Security Gaps
Fair Value US$12.00|49.7% undervalued
MA
Community Contributor
Figma (FIG): The S&P 500’s Design Standard Turning Into an All-in-One Platform
Fair Value US$65.70|7.0% overvalued
TI
Community Contributor
Sleep Cycle's Revenue Set to Rise 10% with Strong Revenue Model
Fair Value SEK 38.04|20.3% undervalued
MA
Community Contributor
Has JB Hi-Fi Lost Its Point of Difference?
Fair Value AU$76.00|54.2% overvalued
RO
Community Contributor