A Look At The Fair Value Of Veekayem Fashion And Apparels Limited (NSE:VEEKAYEM)


Key Insights
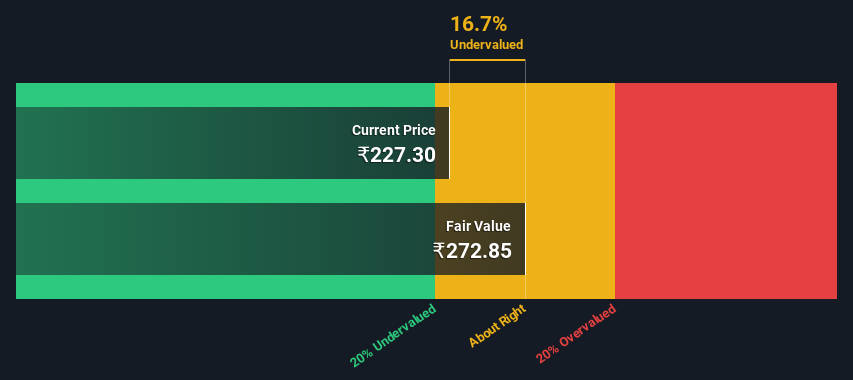
- Veekayem Fashion And Apparels' estimated fair value is ₹273 based on 2 Stage Free Cash Flow to Equity
- Veekayem Fashion And Apparels' ₹227 share price indicates it is trading at similar levels as its fair value estimate
- Veekayem Fashion And Apparels' peers are currently trading at a premium of 7,535% on average
Today we'll do a simple run through of a valuation method used to estimate the attractiveness of Veekayem Fashion And Apparels Limited (NSE:VEEKAYEM) as an investment opportunity by estimating the company's future cash flows and discounting them to their present value. One way to achieve this is by employing the Discounted Cash Flow (DCF) model. It may sound complicated, but actually it is quite simple!
Companies can be valued in a lot of ways, so we would point out that a DCF is not perfect for every situation. If you want to learn more about discounted cash flow, the rationale behind this calculation can be read in detail in the Simply Wall St analysis model.
See our latest analysis for Veekayem Fashion And Apparels
Step By Step Through The Calculation
We are going to use a two-stage DCF model, which, as the name states, takes into account two stages of growth. The first stage is generally a higher growth period which levels off heading towards the terminal value, captured in the second 'steady growth' period. In the first stage we need to estimate the cash flows to the business over the next ten years. Seeing as no analyst estimates of free cash flow are available to us, we have extrapolate the previous free cash flow (FCF) from the company's last reported value. We assume companies with shrinking free cash flow will slow their rate of shrinkage, and that companies with growing free cash flow will see their growth rate slow, over this period. We do this to reflect that growth tends to slow more in the early years than it does in later years.
A DCF is all about the idea that a dollar in the future is less valuable than a dollar today, so we need to discount the sum of these future cash flows to arrive at a present value estimate:
10-year free cash flow (FCF) forecast
| 2024 | 2025 | 2026 | 2027 | 2028 | 2029 | 2030 | 2031 | 2032 | 2033 | |
| Levered FCF (₹, Millions) | ₹127.8m | ₹156.7m | ₹184.7m | ₹211.5m | ₹237.2m | ₹262.2m | ₹286.8m | ₹311.4m | ₹336.4m | ₹362.1m |
| Growth Rate Estimate Source | Est @ 29.47% | Est @ 22.64% | Est @ 17.86% | Est @ 14.52% | Est @ 12.17% | Est @ 10.53% | Est @ 9.39% | Est @ 8.58% | Est @ 8.02% | Est @ 7.63% |
| Present Value (₹, Millions) Discounted @ 18% | ₹108 | ₹112 | ₹112 | ₹109 | ₹103 | ₹96.8 | ₹89.6 | ₹82.4 | ₹75.4 | ₹68.7 |
("Est" = FCF growth rate estimated by Simply Wall St)
Present Value of 10-year Cash Flow (PVCF) = ₹958m
After calculating the present value of future cash flows in the initial 10-year period, we need to calculate the Terminal Value, which accounts for all future cash flows beyond the first stage. The Gordon Growth formula is used to calculate Terminal Value at a future annual growth rate equal to the 5-year average of the 10-year government bond yield of 6.7%. We discount the terminal cash flows to today's value at a cost of equity of 18%.
Terminal Value (TV)= FCF2033 × (1 + g) ÷ (r – g) = ₹362m× (1 + 6.7%) ÷ (18%– 6.7%) = ₹3.4b
Present Value of Terminal Value (PVTV)= TV / (1 + r)10= ₹3.4b÷ ( 1 + 18%)10= ₹645m
The total value is the sum of cash flows for the next ten years plus the discounted terminal value, which results in the Total Equity Value, which in this case is ₹1.6b. To get the intrinsic value per share, we divide this by the total number of shares outstanding. Compared to the current share price of ₹227, the company appears about fair value at a 17% discount to where the stock price trades currently. The assumptions in any calculation have a big impact on the valuation, so it is better to view this as a rough estimate, not precise down to the last cent.
The Assumptions
The calculation above is very dependent on two assumptions. The first is the discount rate and the other is the cash flows. You don't have to agree with these inputs, I recommend redoing the calculations yourself and playing with them. The DCF also does not consider the possible cyclicality of an industry, or a company's future capital requirements, so it does not give a full picture of a company's potential performance. Given that we are looking at Veekayem Fashion And Apparels as potential shareholders, the cost of equity is used as the discount rate, rather than the cost of capital (or weighted average cost of capital, WACC) which accounts for debt. In this calculation we've used 18%, which is based on a levered beta of 1.455. Beta is a measure of a stock's volatility, compared to the market as a whole. We get our beta from the industry average beta of globally comparable companies, with an imposed limit between 0.8 and 2.0, which is a reasonable range for a stable business.
SWOT Analysis for Veekayem Fashion And Apparels
- Earnings growth over the past year exceeded the industry.
- Interest payments on debt are not well covered.
- Current share price is below our estimate of fair value.
- Lack of analyst coverage makes it difficult to determine VEEKAYEM's earnings prospects.
- Debt is not well covered by operating cash flow.
Next Steps:
Although the valuation of a company is important, it shouldn't be the only metric you look at when researching a company. The DCF model is not a perfect stock valuation tool. Rather it should be seen as a guide to "what assumptions need to be true for this stock to be under/overvalued?" If a company grows at a different rate, or if its cost of equity or risk free rate changes sharply, the output can look very different. For Veekayem Fashion And Apparels, there are three pertinent aspects you should explore:
- Risks: As an example, we've found 3 warning signs for Veekayem Fashion And Apparels (2 can't be ignored!) that you need to consider before investing here.
- Other High Quality Alternatives: Do you like a good all-rounder? Explore our interactive list of high quality stocks to get an idea of what else is out there you may be missing!
- Other Environmentally-Friendly Companies: Concerned about the environment and think consumers will buy eco-friendly products more and more? Browse through our interactive list of companies that are thinking about a greener future to discover some stocks you may not have thought of!
PS. The Simply Wall St app conducts a discounted cash flow valuation for every stock on the NSEI every day. If you want to find the calculation for other stocks just search here.
If you're looking to trade Veekayem Fashion and Apparels, open an account with the lowest-cost platform trusted by professionals, Interactive Brokers.
With clients in over 200 countries and territories, and access to 160 markets, IBKR lets you trade stocks, options, futures, forex, bonds and funds from a single integrated account.
Enjoy no hidden fees, no account minimums, and FX conversion rates as low as 0.03%, far better than what most brokers offer.
Sponsored ContentNew: Manage All Your Stock Portfolios in One Place
We've created the ultimate portfolio companion for stock investors, and it's free.
• Connect an unlimited number of Portfolios and see your total in one currency
• Be alerted to new Warning Signs or Risks via email or mobile
• Track the Fair Value of your stocks
Have feedback on this article? Concerned about the content? Get in touch with us directly. Alternatively, email editorial-team (at) simplywallst.com.
This article by Simply Wall St is general in nature. We provide commentary based on historical data and analyst forecasts only using an unbiased methodology and our articles are not intended to be financial advice. It does not constitute a recommendation to buy or sell any stock, and does not take account of your objectives, or your financial situation. We aim to bring you long-term focused analysis driven by fundamental data. Note that our analysis may not factor in the latest price-sensitive company announcements or qualitative material. Simply Wall St has no position in any stocks mentioned.
About NSEI:VEEKAYEM
Veekayem Fashion and Apparels
Engages in the garment manufacturing business in India and internationally.
Solid track record with mediocre balance sheet.
Similar Companies
Market Insights

Community Narratives

