
Advertisement
We Like These Underlying Return On Capital Trends At Suryalakshmi Cotton Mills (NSE:SURYALAXMI)

If you're looking for a multi-bagger, there's a few things to keep an eye out for. Ideally, a business will show two trends; firstly a growing return on capital employed (ROCE) and secondly, an increasing amount of capital employed. Put simply, these types of businesses are compounding machines, meaning they are continually reinvesting their earnings at ever-higher rates of return. Speaking of which, we noticed some great changes in Suryalakshmi Cotton Mills' (NSE:SURYALAXMI) returns on capital, so let's have a look.
Return On Capital Employed (ROCE): What Is It?
Just to clarify if you're unsure, ROCE is a metric for evaluating how much pre-tax income (in percentage terms) a company earns on the capital invested in its business. Analysts use this formula to calculate it for Suryalakshmi Cotton Mills:
Return on Capital Employed = Earnings Before Interest and Tax (EBIT) ÷ (Total Assets - Current Liabilities)
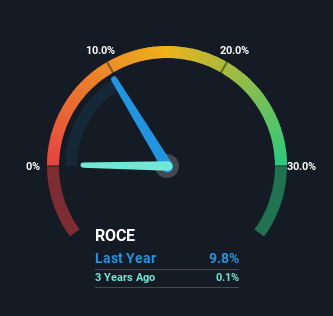
0.098 = ₹352m ÷ (₹6.8b - ₹3.2b) (Based on the trailing twelve months to December 2023).
Thus, Suryalakshmi Cotton Mills has an ROCE of 9.8%. On its own, that's a low figure but it's around the 11% average generated by the Luxury industry.
View our latest analysis for Suryalakshmi Cotton Mills
While the past is not representative of the future, it can be helpful to know how a company has performed historically, which is why we have this chart above. If you want to delve into the historical earnings , check out these free graphs detailing revenue and cash flow performance of Suryalakshmi Cotton Mills.
What The Trend Of ROCE Can Tell Us
Suryalakshmi Cotton Mills has not disappointed in regards to ROCE growth. We found that the returns on capital employed over the last five years have risen by 63%. That's a very favorable trend because this means that the company is earning more per dollar of capital that's being employed. Interestingly, the business may be becoming more efficient because it's applying 23% less capital than it was five years ago. If this trend continues, the business might be getting more efficient but it's shrinking in terms of total assets.
On a separate but related note, it's important to know that Suryalakshmi Cotton Mills has a current liabilities to total assets ratio of 47%, which we'd consider pretty high. This can bring about some risks because the company is basically operating with a rather large reliance on its suppliers or other sorts of short-term creditors. While it's not necessarily a bad thing, it can be beneficial if this ratio is lower.
In Conclusion...
In the end, Suryalakshmi Cotton Mills has proven it's capital allocation skills are good with those higher returns from less amount of capital. Since the stock has returned a staggering 111% to shareholders over the last five years, it looks like investors are recognizing these changes. So given the stock has proven it has promising trends, it's worth researching the company further to see if these trends are likely to persist.
One final note, you should learn about the 4 warning signs we've spotted with Suryalakshmi Cotton Mills (including 1 which is a bit unpleasant) .
While Suryalakshmi Cotton Mills may not currently earn the highest returns, we've compiled a list of companies that currently earn more than 25% return on equity. Check out this free list here.
New: Manage All Your Stock Portfolios in One Place
We've created the ultimate portfolio companion for stock investors, and it's free.
• Connect an unlimited number of Portfolios and see your total in one currency
• Be alerted to new Warning Signs or Risks via email or mobile
• Track the Fair Value of your stocks
Have feedback on this article? Concerned about the content? Get in touch with us directly. Alternatively, email editorial-team (at) simplywallst.com.
This article by Simply Wall St is general in nature. We provide commentary based on historical data and analyst forecasts only using an unbiased methodology and our articles are not intended to be financial advice. It does not constitute a recommendation to buy or sell any stock, and does not take account of your objectives, or your financial situation. We aim to bring you long-term focused analysis driven by fundamental data. Note that our analysis may not factor in the latest price-sensitive company announcements or qualitative material. Simply Wall St has no position in any stocks mentioned.
About NSEI:SURYALAXMI
Suryalakshmi Cotton Mills
Engages in the manufacture and sale of cotton and blended yarns, denim fabrics, and garments in India, Bangladesh, Ethiopia, Guatemala, Kenya, Mauritius, Madagascar, South Korea, and internationally.
Slight with mediocre balance sheet.
Market Insights

Advertisement
Community Narratives
Groundbreaking therapies that could change the treatment landscape for PTSD, fibromyalgia, MS & Alzheimer’s
Fair Value US$6.20|86.9% undervalued
CM
Community Contributor
DigitalOcean Will Grow 14% by Embracing AI with Paperspace Acquisition
Fair Value US$50.00|41.7% undervalued
NE
Community Contributor
Viant Technology: A Rising AdTech Challenger in the AI-Powered CTV Market
Fair Value US$38.61|63.2% undervalued
BL
Community Contributor
Volvo will Accelerate Forward into Electric and Autonomous Leadership in Five Years
Fair Value SEK 438.80|39.7% undervalued
UN
Community Contributor