
Advertisement
What Shiva Texyarn Limited's (NSE:SHIVATEX) 36% Share Price Gain Is Not Telling You

Despite an already strong run, Shiva Texyarn Limited (NSE:SHIVATEX) shares have been powering on, with a gain of 36% in the last thirty days. Looking back a bit further, it's encouraging to see the stock is up 58% in the last year.
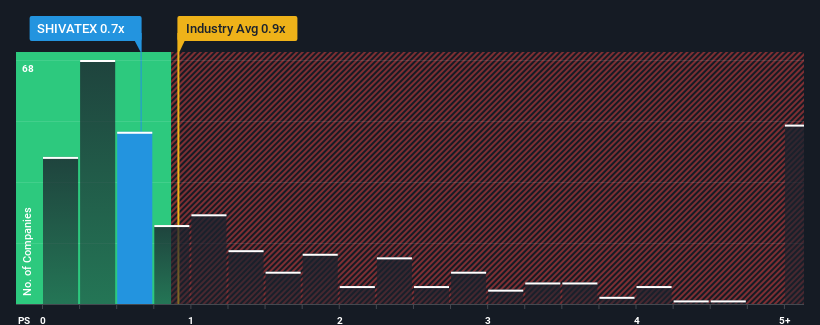
Even after such a large jump in price, it's still not a stretch to say that Shiva Texyarn's price-to-sales (or "P/S") ratio of 0.7x right now seems quite "middle-of-the-road" compared to the Luxury industry in India, where the median P/S ratio is around 0.9x. While this might not raise any eyebrows, if the P/S ratio is not justified investors could be missing out on a potential opportunity or ignoring looming disappointment.
See our latest analysis for Shiva Texyarn
How Has Shiva Texyarn Performed Recently?
For instance, Shiva Texyarn's receding revenue in recent times would have to be some food for thought. Perhaps investors believe the recent revenue performance is enough to keep in line with the industry, which is keeping the P/S from dropping off. If you like the company, you'd at least be hoping this is the case so that you could potentially pick up some stock while it's not quite in favour.
Want the full picture on earnings, revenue and cash flow for the company? Then our free report on Shiva Texyarn will help you shine a light on its historical performance.What Are Revenue Growth Metrics Telling Us About The P/S?
The only time you'd be comfortable seeing a P/S like Shiva Texyarn's is when the company's growth is tracking the industry closely.
Taking a look back first, the company's revenue growth last year wasn't something to get excited about as it posted a disappointing decline of 23%. Regardless, revenue has managed to lift by a handy 18% in aggregate from three years ago, thanks to the earlier period of growth. Although it's been a bumpy ride, it's still fair to say the revenue growth recently has been mostly respectable for the company.
Comparing the recent medium-term revenue trends against the industry's one-year growth forecast of 13% shows it's noticeably less attractive.
With this information, we find it interesting that Shiva Texyarn is trading at a fairly similar P/S compared to the industry. Apparently many investors in the company are less bearish than recent times would indicate and aren't willing to let go of their stock right now. Maintaining these prices will be difficult to achieve as a continuation of recent revenue trends is likely to weigh down the shares eventually.
What We Can Learn From Shiva Texyarn's P/S?
Shiva Texyarn's stock has a lot of momentum behind it lately, which has brought its P/S level with the rest of the industry. Typically, we'd caution against reading too much into price-to-sales ratios when settling on investment decisions, though it can reveal plenty about what other market participants think about the company.
Our examination of Shiva Texyarn revealed its poor three-year revenue trends aren't resulting in a lower P/S as per our expectations, given they look worse than current industry outlook. When we see weak revenue with slower than industry growth, we suspect the share price is at risk of declining, bringing the P/S back in line with expectations. Unless there is a significant improvement in the company's medium-term performance, it will be difficult to prevent the P/S ratio from declining to a more reasonable level.
You should always think about risks. Case in point, we've spotted 4 warning signs for Shiva Texyarn you should be aware of, and 2 of them shouldn't be ignored.
If these risks are making you reconsider your opinion on Shiva Texyarn, explore our interactive list of high quality stocks to get an idea of what else is out there.
New: Manage All Your Stock Portfolios in One Place
We've created the ultimate portfolio companion for stock investors, and it's free.
• Connect an unlimited number of Portfolios and see your total in one currency
• Be alerted to new Warning Signs or Risks via email or mobile
• Track the Fair Value of your stocks
Have feedback on this article? Concerned about the content? Get in touch with us directly. Alternatively, email editorial-team (at) simplywallst.com.
This article by Simply Wall St is general in nature. We provide commentary based on historical data and analyst forecasts only using an unbiased methodology and our articles are not intended to be financial advice. It does not constitute a recommendation to buy or sell any stock, and does not take account of your objectives, or your financial situation. We aim to bring you long-term focused analysis driven by fundamental data. Note that our analysis may not factor in the latest price-sensitive company announcements or qualitative material. Simply Wall St has no position in any stocks mentioned.
About NSEI:SHIVATEX
Shiva Texyarn
Manufactures and sells cotton yarn, coated and laminated fabrics, home textiles, and other value-added textile products in India and internationally.
Slight with mediocre balance sheet.
Similar Companies
Market Insights

Advertisement
Community Narratives

BMW cruising ahead with new EVs and premium models to boost revenue 5%
Fair Value €135.07|44.6% undervalued
UN
Community Contributor
EU#2 - From Humble Beginnings to Global Powerhouse
Fair Value DKK 851.04|46.4% undervalued
TO
Community Contributor