
Advertisement
Has Precot Limited's (NSE:PRECOT) Impressive Stock Performance Got Anything to Do With Its Fundamentals?

Most readers would already be aware that Precot's (NSE:PRECOT) stock increased significantly by 34% over the past three months. As most would know, fundamentals are what usually guide market price movements over the long-term, so we decided to look at the company's key financial indicators today to determine if they have any role to play in the recent price movement. Specifically, we decided to study Precot's ROE in this article.
Return on equity or ROE is a key measure used to assess how efficiently a company's management is utilizing the company's capital. In short, ROE shows the profit each dollar generates with respect to its shareholder investments.
How Do You Calculate Return On Equity?
Return on equity can be calculated by using the formula:
Return on Equity = Net Profit (from continuing operations) ÷ Shareholders' Equity
So, based on the above formula, the ROE for Precot is:
16% = ₹679m ÷ ₹4.4b (Based on the trailing twelve months to March 2025).
The 'return' is the profit over the last twelve months. Another way to think of that is that for every ₹1 worth of equity, the company was able to earn ₹0.16 in profit.
See our latest analysis for Precot
What Is The Relationship Between ROE And Earnings Growth?
So far, we've learned that ROE is a measure of a company's profitability. Depending on how much of these profits the company reinvests or "retains", and how effectively it does so, we are then able to assess a company’s earnings growth potential. Assuming all else is equal, companies that have both a higher return on equity and higher profit retention are usually the ones that have a higher growth rate when compared to companies that don't have the same features.
Precot's Earnings Growth And 16% ROE
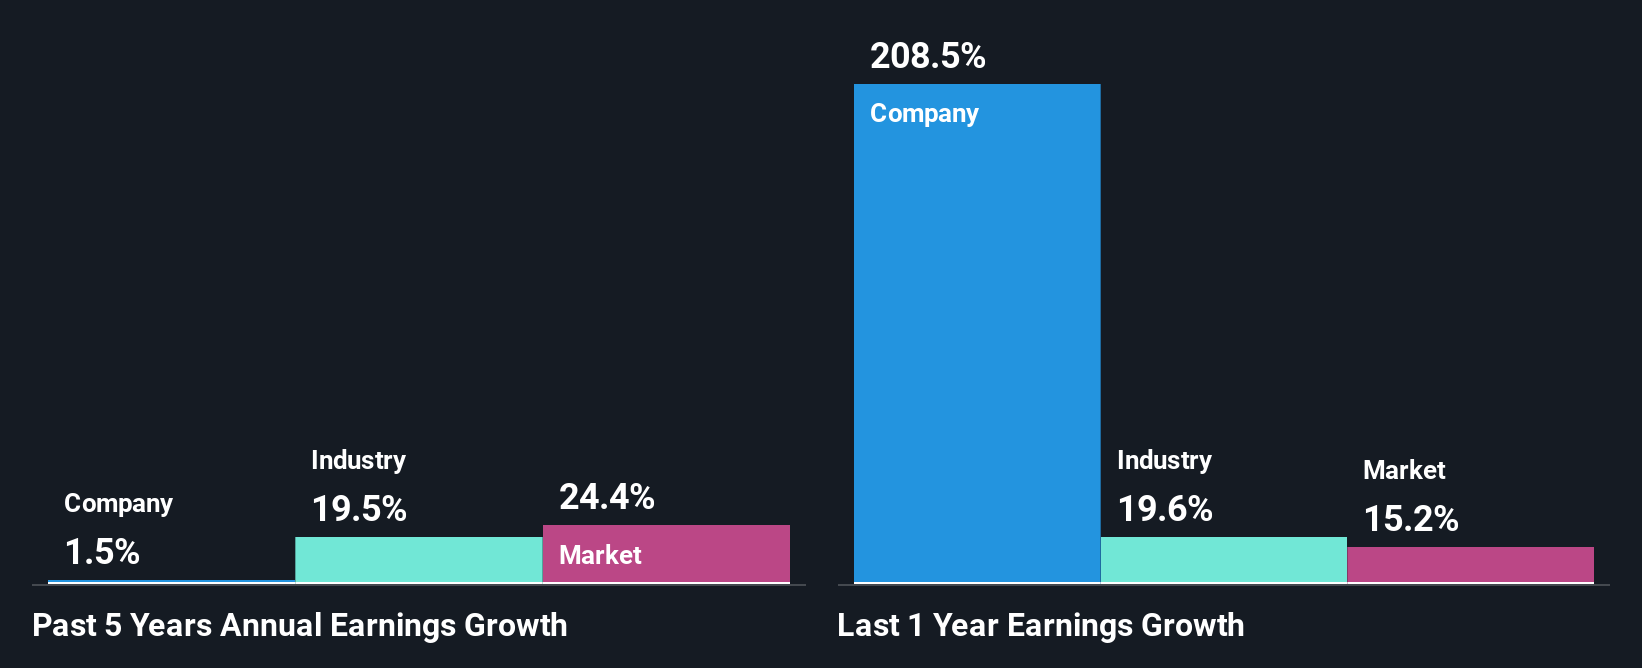
To start with, Precot's ROE looks acceptable. Further, the company's ROE compares quite favorably to the industry average of 7.8%. Given the circumstances, we can't help but wonder why Precot saw little to no growth in the past five years. Therefore, there could be some other aspects that could potentially be preventing the company from growing. These include low earnings retention or poor allocation of capital.
Next, on comparing with the industry net income growth, we found that Precot's reported growth was lower than the industry growth of 20% over the last few years, which is not something we like to see.
The basis for attaching value to a company is, to a great extent, tied to its earnings growth. It’s important for an investor to know whether the market has priced in the company's expected earnings growth (or decline). By doing so, they will have an idea if the stock is headed into clear blue waters or if swampy waters await. Is Precot fairly valued compared to other companies? These 3 valuation measures might help you decide.
Is Precot Efficiently Re-investing Its Profits?
Precot's low three-year median payout ratio of 8.6% (implying that the company keeps91% of its income) should mean that the company is retaining most of its earnings to fuel its growth and this should be reflected in its growth number, but that's not the case.
Additionally, Precot has paid dividends over a period of at least ten years, which means that the company's management is determined to pay dividends even if it means little to no earnings growth.
Conclusion
Overall, we feel that Precot certainly does have some positive factors to consider. Yet, the low earnings growth is a bit concerning, especially given that the company has a high rate of return and is reinvesting ma huge portion of its profits. By the looks of it, there could be some other factors, not necessarily in control of the business, that's preventing growth. So far, we've only made a quick discussion around the company's earnings growth. To gain further insights into Precot's past profit growth, check out this visualization of past earnings, revenue and cash flows.
New: Manage All Your Stock Portfolios in One Place
We've created the ultimate portfolio companion for stock investors, and it's free.
• Connect an unlimited number of Portfolios and see your total in one currency
• Be alerted to new Warning Signs or Risks via email or mobile
• Track the Fair Value of your stocks
Have feedback on this article? Concerned about the content? Get in touch with us directly. Alternatively, email editorial-team (at) simplywallst.com.
This article by Simply Wall St is general in nature. We provide commentary based on historical data and analyst forecasts only using an unbiased methodology and our articles are not intended to be financial advice. It does not constitute a recommendation to buy or sell any stock, and does not take account of your objectives, or your financial situation. We aim to bring you long-term focused analysis driven by fundamental data. Note that our analysis may not factor in the latest price-sensitive company announcements or qualitative material. Simply Wall St has no position in any stocks mentioned.
About NSEI:PRECOT
Precot
Manufactures and sells yarn and technical textile products in India and internationally.
Solid track record with adequate balance sheet.
Similar Companies
Market Insights


Advertisement
Community Narratives
For the Emperor: Why Games Workshop Could Be a Star Investment
Fair Value UK£160.00|0.5% overvalued
RO
Community Contributor
Securitas will boost margins with AI and tech-driven services
Fair Value SEK 260.91|44.5% undervalued
UN
Community Contributor
A Leader in EV Charging with Growth Potential
Fair Value €27.00|18.7% undervalued
TI
Community Contributor