Advertisement
Vedant Fashions And 2 Other Top Growth Stocks With High Insider Ownership

Simply Wall St
Reviewed by Simply Wall St
In a market environment characterized by mixed returns and sector rotations, identifying growth companies with high insider ownership can offer unique investment opportunities. Insider ownership often signifies confidence in the company's future prospects, making it an essential factor to consider amid current economic uncertainties.
Top 10 Growth Companies With High Insider Ownership
| Name | Insider Ownership | Earnings Growth |
| Gaming Innovation Group (OB:GIG) | 26.7% | 37.4% |
| Medley (TSE:4480) | 34% | 28.7% |
| Fine M-TecLTD (KOSDAQ:A441270) | 17.1% | 36.4% |
| KebNi (OM:KEBNI B) | 37.8% | 90.4% |
| Credo Technology Group Holding (NasdaqGS:CRDO) | 14.4% | 60.9% |
| Calliditas Therapeutics (OM:CALTX) | 11.6% | 52.9% |
| Vow (OB:VOW) | 31.7% | 97.7% |
| Adocia (ENXTPA:ADOC) | 11.9% | 63% |
| EHang Holdings (NasdaqGM:EH) | 32.8% | 74.3% |
| HANA Micron (KOSDAQ:A067310) | 20% | 97.4% |
Here we highlight a subset of our preferred stocks from the screener.
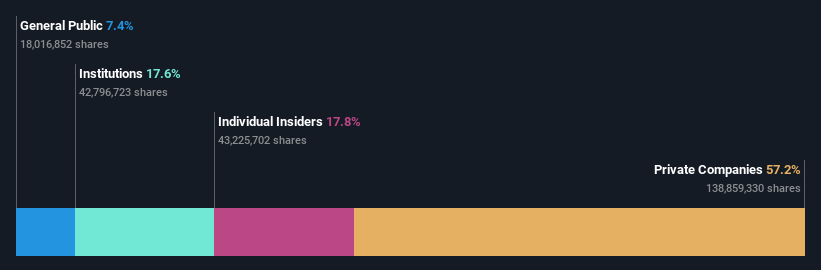
Vedant Fashions (NSEI:MANYAVAR)
Simply Wall St Growth Rating: ★★★★☆☆
Overview: Vedant Fashions Limited manufactures and trades wedding and celebration wear in India and internationally, with a market cap of ₹265.74 billion.
Operations: Vedant Fashions generates revenue primarily from branded fashion apparel and accessories, amounting to ₹12.96 billion.
Insider Ownership: 17.8%
Vedant Fashions, despite recent declines in quarterly revenue (INR 2.61 billion) and net income (INR 624.89 million), shows promising growth prospects with earnings forecasted to grow at 17.69% annually, outpacing the Indian market's average of 16.2%. The company's high insider ownership aligns management interests with shareholders, potentially fostering long-term value creation. However, investors should note the unstable dividend track record and recent financial performance setbacks when considering this stock for growth potential.
- Click here to discover the nuances of Vedant Fashions with our detailed analytical future growth report.
- Our comprehensive valuation report raises the possibility that Vedant Fashions is priced higher than what may be justified by its financials.
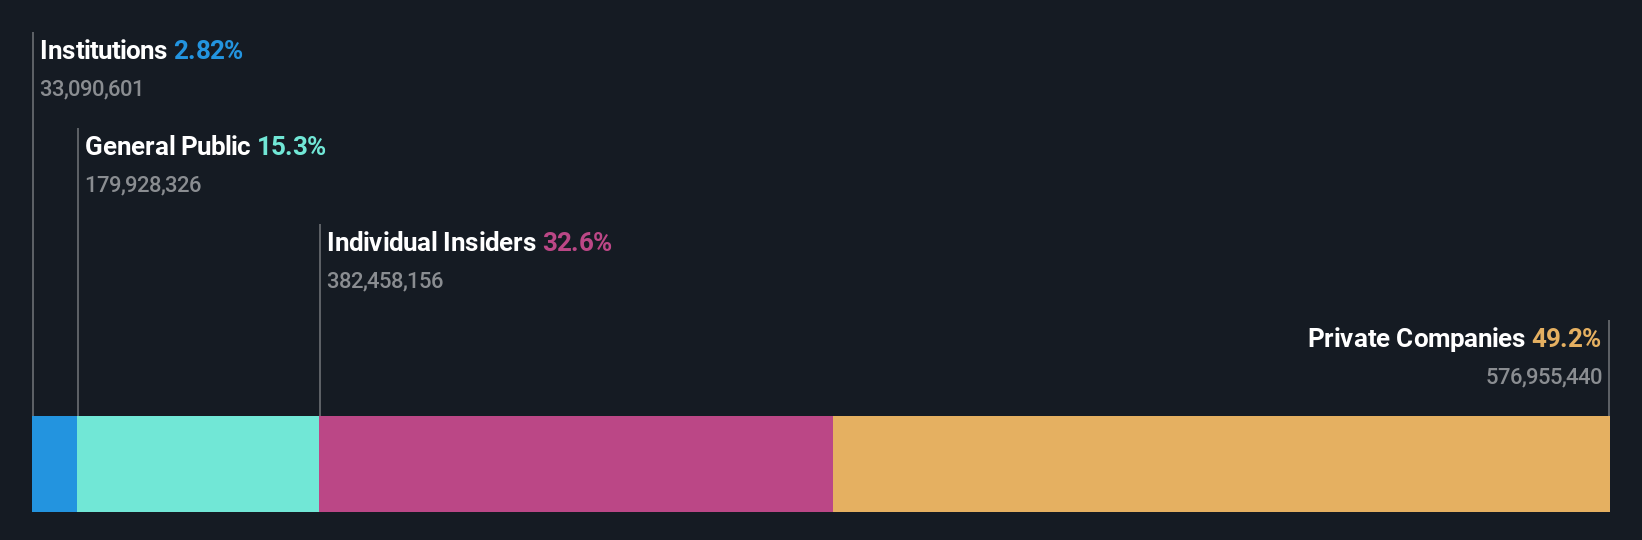
Hoshine Silicon Industry (SHSE:603260)
Simply Wall St Growth Rating: ★★★★★☆
Overview: Hoshine Silicon Industry Co., Ltd. produces and sells silicon-based materials both in China and internationally, with a market cap of CN¥54.87 billion.
Operations: The company's revenue segments are derived from the production and sale of silicon-based materials.
Insider Ownership: 32.6%
Hoshine Silicon Industry's high insider ownership aligns management interests with shareholders, fostering potential long-term value creation. Despite being removed from key indices like the SSE 180, the company shows robust growth prospects with earnings expected to grow 31.7% annually, outpacing the CN market's 22.1%. However, profitability has declined with net profit margins dropping to 8.2% from last year's 17.8%, and its return on equity forecasted to be low at 12.1% in three years.
- Navigate through the intricacies of Hoshine Silicon Industry with our comprehensive analyst estimates report here.
- Insights from our recent valuation report point to the potential undervaluation of Hoshine Silicon Industry shares in the market.
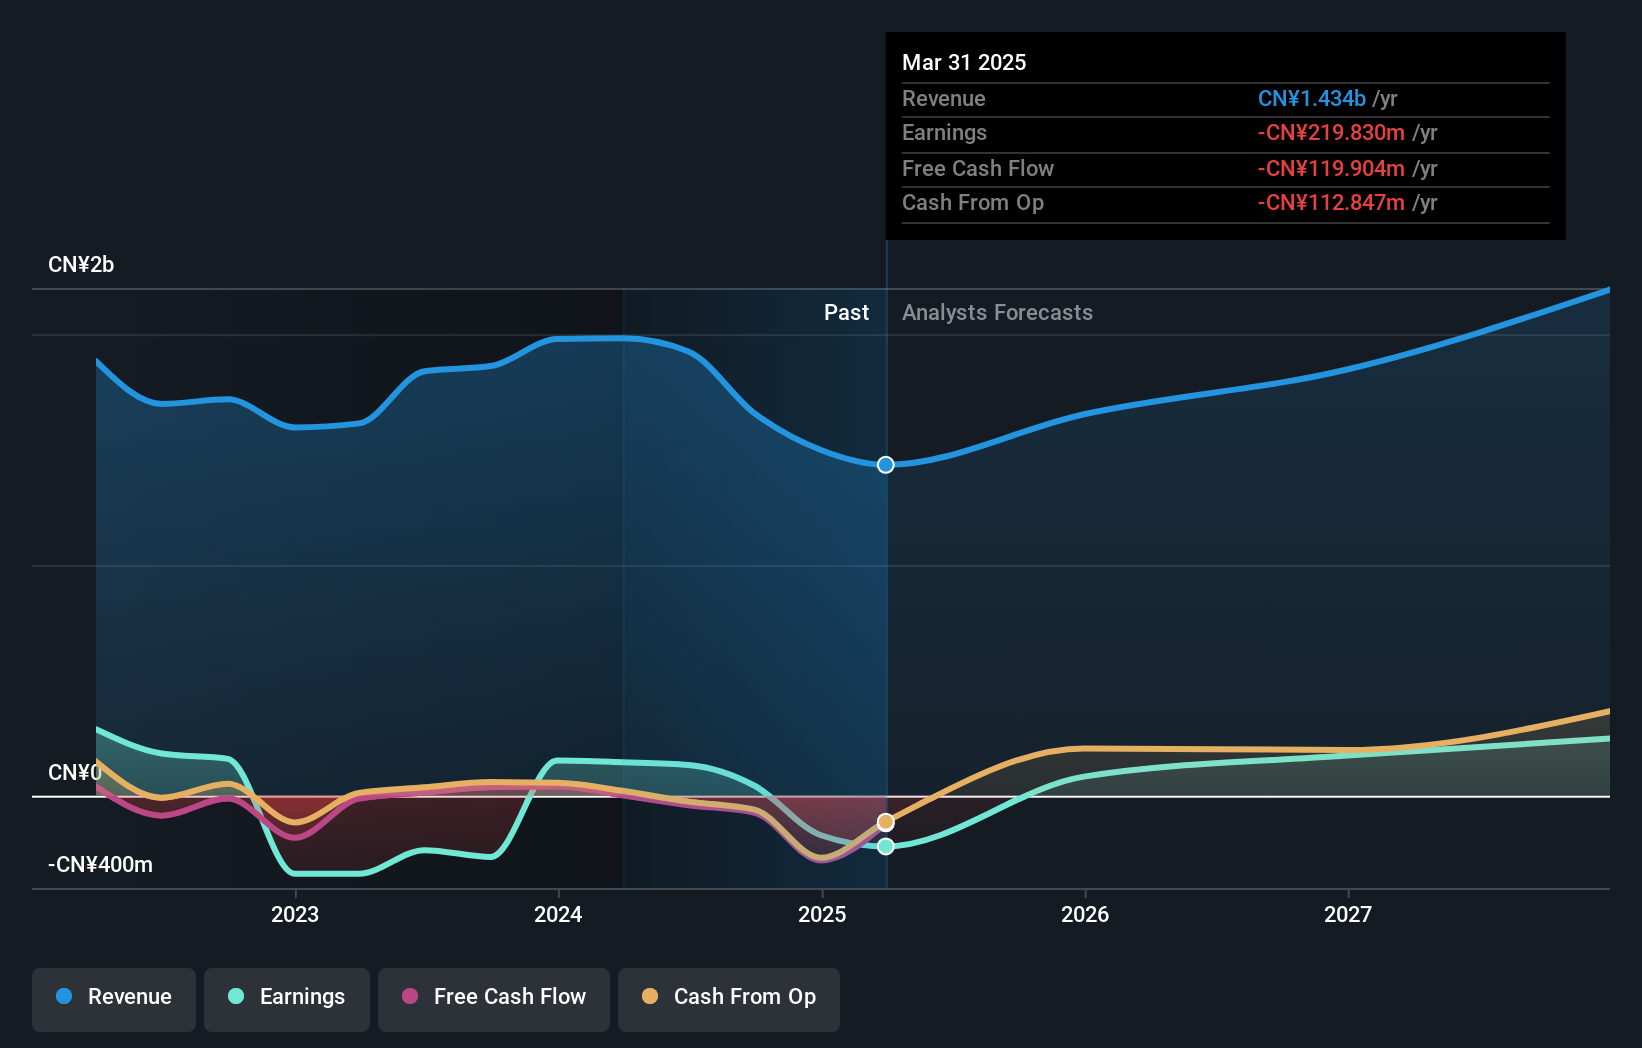
Beijing SuperMap Software (SZSE:300036)
Simply Wall St Growth Rating: ★★★★★☆
Overview: Beijing SuperMap Software Co., Ltd. provides geographic information system (GIS) and geospatial intelligence software products and services both in China and internationally, with a market cap of approximately CN¥6.50 billion.
Operations: The company's revenue segments include Software, which generated CN¥1.96 billion.
Insider Ownership: 18%
Beijing SuperMap Software demonstrates strong growth potential with earnings forecasted to grow 35.1% annually, significantly outpacing the CN market's 22.1%. The company's revenue is also expected to increase by 21.7% per year, surpassing the market average of 13.6%. Recent buyback activities totaling CNY 112.92 million reflect confidence in its future prospects and aim to enhance shareholder value through employee stock ownership plans and equity incentives, despite a relatively low forecasted return on equity of 9.9%.
- Dive into the specifics of Beijing SuperMap Software here with our thorough growth forecast report.
- Our valuation report here indicates Beijing SuperMap Software may be overvalued.
Where To Now?
- Discover the full array of 1460 Fast Growing Companies With High Insider Ownership right here.
- Are these companies part of your investment strategy? Use Simply Wall St to consolidate your holdings into a portfolio and gain insights with our comprehensive analysis tools.
- Streamline your investment strategy with Simply Wall St's app for free and benefit from extensive research on stocks across all corners of the world.
Searching for a Fresh Perspective?
- Explore high-performing small cap companies that haven't yet garnered significant analyst attention.
- Diversify your portfolio with solid dividend payers offering reliable income streams to weather potential market turbulence.
- Find companies with promising cash flow potential yet trading below their fair value.
This article by Simply Wall St is general in nature. We provide commentary based on historical data and analyst forecasts only using an unbiased methodology and our articles are not intended to be financial advice. It does not constitute a recommendation to buy or sell any stock, and does not take account of your objectives, or your financial situation. We aim to bring you long-term focused analysis driven by fundamental data. Note that our analysis may not factor in the latest price-sensitive company announcements or qualitative material. Simply Wall St has no position in any stocks mentioned.The analysis only considers stock directly held by insiders. It does not include indirectly owned stock through other vehicles such as corporate and/or trust entities. All forecast revenue and earnings growth rates quoted are in terms of annualised (per annum) growth rates over 1-3 years.
New: Manage All Your Stock Portfolios in One Place
We've created the ultimate portfolio companion for stock investors, and it's free.
• Connect an unlimited number of Portfolios and see your total in one currency
• Be alerted to new Warning Signs or Risks via email or mobile
• Track the Fair Value of your stocks
Have feedback on this article? Concerned about the content? Get in touch with us directly. Alternatively, email editorial-team@simplywallst.com
About NSEI:MANYAVAR
Vedant Fashions
Manufactures, trades, and sells wedding and celebration wear in India Nepal, the United States, Canada, the United Arab Emirates, the United Kingdom, and internationally.
Flawless balance sheet with acceptable track record.
Similar Companies
Market Insights

Advertisement
Community Narratives
MINISO's fair value is projected at 26.69 with an anticipated PE ratio shift of 20x
Fair Value US$24.03|11.0% undervalued
BE
Community Contributor
Procter & Gamble: A Dividend Giant Facing Slowing Growth
Fair Value US$119.81|23.3% overvalued
AN
Community Contributor
Eli Lilly's Future Growth Driven by Tirzepatide and Favorable Market Conditions
Fair Value US$1.19k|13.8% undervalued
EA
Community Contributor