Does JBF Industries (NSE:JBFIND) Have A Healthy Balance Sheet?


Howard Marks put it nicely when he said that, rather than worrying about share price volatility, 'The possibility of permanent loss is the risk I worry about... and every practical investor I know worries about.' It's only natural to consider a company's balance sheet when you examine how risky it is, since debt is often involved when a business collapses. We note that JBF Industries Limited (NSE:JBFIND) does have debt on its balance sheet. But the real question is whether this debt is making the company risky.
What Risk Does Debt Bring?
Debt assists a business until the business has trouble paying it off, either with new capital or with free cash flow. Ultimately, if the company can't fulfill its legal obligations to repay debt, shareholders could walk away with nothing. However, a more usual (but still expensive) situation is where a company must dilute shareholders at a cheap share price simply to get debt under control. Of course, plenty of companies use debt to fund growth, without any negative consequences. The first step when considering a company's debt levels is to consider its cash and debt together.
Check out our latest analysis for JBF Industries
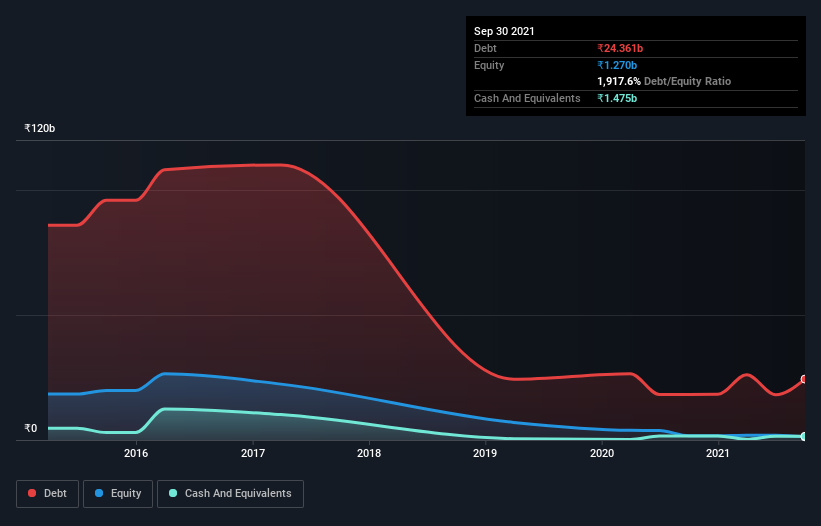
How Much Debt Does JBF Industries Carry?
You can click the graphic below for the historical numbers, but it shows that as of September 2021 JBF Industries had ₹24.4b of debt, an increase on ₹18.2b, over one year. However, it also had ₹1.48b in cash, and so its net debt is ₹22.9b.
How Strong Is JBF Industries' Balance Sheet?
According to the last reported balance sheet, JBF Industries had liabilities of ₹34.6b due within 12 months, and liabilities of ₹371.1m due beyond 12 months. On the other hand, it had cash of ₹1.48b and ₹11.3b worth of receivables due within a year. So its liabilities total ₹22.2b more than the combination of its cash and short-term receivables.
The deficiency here weighs heavily on the ₹1.61b company itself, as if a child were struggling under the weight of an enormous back-pack full of books, his sports gear, and a trumpet. So we definitely think shareholders need to watch this one closely. After all, JBF Industries would likely require a major re-capitalisation if it had to pay its creditors today.
We measure a company's debt load relative to its earnings power by looking at its net debt divided by its earnings before interest, tax, depreciation, and amortization (EBITDA) and by calculating how easily its earnings before interest and tax (EBIT) cover its interest expense (interest cover). The advantage of this approach is that we take into account both the absolute quantum of debt (with net debt to EBITDA) and the actual interest expenses associated with that debt (with its interest cover ratio).
JBF Industries shareholders face the double whammy of a high net debt to EBITDA ratio (8.0), and fairly weak interest coverage, since EBIT is just 0.82 times the interest expense. This means we'd consider it to have a heavy debt load. However, the silver lining was that JBF Industries achieved a positive EBIT of ₹2.0b in the last twelve months, an improvement on the prior year's loss. There's no doubt that we learn most about debt from the balance sheet. But it is JBF Industries's earnings that will influence how the balance sheet holds up in the future. So if you're keen to discover more about its earnings, it might be worth checking out this graph of its long term earnings trend.
Finally, while the tax-man may adore accounting profits, lenders only accept cold hard cash. So it is important to check how much of its earnings before interest and tax (EBIT) converts to actual free cash flow. Looking at the most recent year, JBF Industries recorded free cash flow of 36% of its EBIT, which is weaker than we'd expect. That's not great, when it comes to paying down debt.
Our View
On the face of it, JBF Industries's interest cover left us tentative about the stock, and its level of total liabilities was no more enticing than the one empty restaurant on the busiest night of the year. Having said that, its ability to grow its EBIT isn't such a worry. After considering the datapoints discussed, we think JBF Industries has too much debt. While some investors love that sort of risky play, it's certainly not our cup of tea. There's no doubt that we learn most about debt from the balance sheet. However, not all investment risk resides within the balance sheet - far from it. Case in point: We've spotted 2 warning signs for JBF Industries you should be aware of.
If you're interested in investing in businesses that can grow profits without the burden of debt, then check out this free list of growing businesses that have net cash on the balance sheet.
New: Manage All Your Stock Portfolios in One Place
We've created the ultimate portfolio companion for stock investors, and it's free.
• Connect an unlimited number of Portfolios and see your total in one currency
• Be alerted to new Warning Signs or Risks via email or mobile
• Track the Fair Value of your stocks
Have feedback on this article? Concerned about the content? Get in touch with us directly. Alternatively, email editorial-team (at) simplywallst.com.
This article by Simply Wall St is general in nature. We provide commentary based on historical data and analyst forecasts only using an unbiased methodology and our articles are not intended to be financial advice. It does not constitute a recommendation to buy or sell any stock, and does not take account of your objectives, or your financial situation. We aim to bring you long-term focused analysis driven by fundamental data. Note that our analysis may not factor in the latest price-sensitive company announcements or qualitative material. Simply Wall St has no position in any stocks mentioned.
About NSEI:JBFIND
JBF Industries
JBF Industries Limited, together with its subsidiaries, engages in the manufacture and sale of polyester chips, and polyester and processed yarns in India and internationally.
Fair value with imperfect balance sheet.
Similar Companies
Market Insights

Community Narratives


