
Advertisement
Bhartiya International Ltd. (NSE:BIL) May Have Run Too Fast Too Soon With Recent 25% Price Plummet

The Bhartiya International Ltd. (NSE:BIL) share price has fared very poorly over the last month, falling by a substantial 25%. Looking at the bigger picture, even after this poor month the stock is up 80% in the last year.
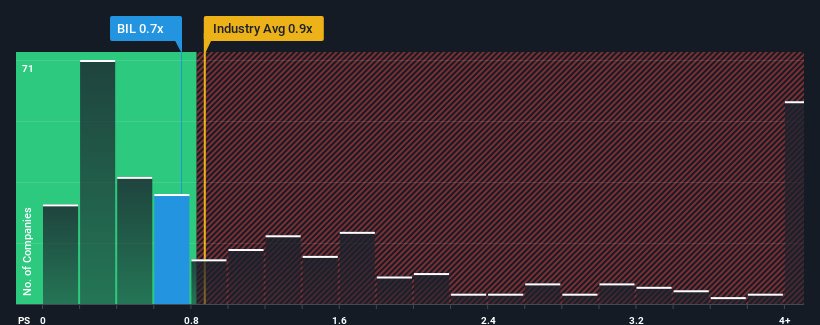
Even after such a large drop in price, there still wouldn't be many who think Bhartiya International's price-to-sales (or "P/S") ratio of 0.7x is worth a mention when the median P/S in India's Luxury industry is similar at about 0.9x. Although, it's not wise to simply ignore the P/S without explanation as investors may be disregarding a distinct opportunity or a costly mistake.
Check out our latest analysis for Bhartiya International
How Has Bhartiya International Performed Recently?
The revenue growth achieved at Bhartiya International over the last year would be more than acceptable for most companies. Perhaps the market is expecting future revenue performance to only keep up with the broader industry, which has keeping the P/S in line with expectations. If that doesn't eventuate, then existing shareholders probably aren't too pessimistic about the future direction of the share price.
We don't have analyst forecasts, but you can see how recent trends are setting up the company for the future by checking out our free report on Bhartiya International's earnings, revenue and cash flow.How Is Bhartiya International's Revenue Growth Trending?
In order to justify its P/S ratio, Bhartiya International would need to produce growth that's similar to the industry.
Retrospectively, the last year delivered an exceptional 30% gain to the company's top line. The strong recent performance means it was also able to grow revenue by 42% in total over the last three years. Accordingly, shareholders would have definitely welcomed those medium-term rates of revenue growth.
This is in contrast to the rest of the industry, which is expected to grow by 91% over the next year, materially higher than the company's recent medium-term annualised growth rates.
With this information, we find it interesting that Bhartiya International is trading at a fairly similar P/S compared to the industry. Apparently many investors in the company are less bearish than recent times would indicate and aren't willing to let go of their stock right now. They may be setting themselves up for future disappointment if the P/S falls to levels more in line with recent growth rates.
The Final Word
Following Bhartiya International's share price tumble, its P/S is just clinging on to the industry median P/S. Generally, our preference is to limit the use of the price-to-sales ratio to establishing what the market thinks about the overall health of a company.
We've established that Bhartiya International's average P/S is a bit surprising since its recent three-year growth is lower than the wider industry forecast. When we see weak revenue with slower than industry growth, we suspect the share price is at risk of declining, bringing the P/S back in line with expectations. Unless there is a significant improvement in the company's medium-term performance, it will be difficult to prevent the P/S ratio from declining to a more reasonable level.
It's always necessary to consider the ever-present spectre of investment risk. We've identified 3 warning signs with Bhartiya International (at least 1 which is a bit concerning), and understanding them should be part of your investment process.
If strong companies turning a profit tickle your fancy, then you'll want to check out this free list of interesting companies that trade on a low P/E (but have proven they can grow earnings).
Valuation is complex, but we're here to simplify it.
Discover if Bhartiya International might be undervalued or overvalued with our detailed analysis, featuring fair value estimates, potential risks, dividends, insider trades, and its financial condition.
Access Free AnalysisHave feedback on this article? Concerned about the content? Get in touch with us directly. Alternatively, email editorial-team (at) simplywallst.com.
This article by Simply Wall St is general in nature. We provide commentary based on historical data and analyst forecasts only using an unbiased methodology and our articles are not intended to be financial advice. It does not constitute a recommendation to buy or sell any stock, and does not take account of your objectives, or your financial situation. We aim to bring you long-term focused analysis driven by fundamental data. Note that our analysis may not factor in the latest price-sensitive company announcements or qualitative material. Simply Wall St has no position in any stocks mentioned.
About NSEI:BIL
Bhartiya International
Manufactures, trades in, and sells leather and textile products in India.
Questionable track record with imperfect balance sheet.
Similar Companies
Market Insights

Advertisement
Community Narratives
Groundbreaking therapies that could change the treatment landscape for PTSD, fibromyalgia, MS & Alzheimer’s
Fair Value US$6.20|86.9% undervalued
CM
Community Contributor
DigitalOcean Will Grow 14% by Embracing AI with Paperspace Acquisition
Fair Value US$50.00|41.7% undervalued
NE
Community Contributor
Viant Technology: A Rising AdTech Challenger in the AI-Powered CTV Market
Fair Value US$38.61|63.2% undervalued
BL
Community Contributor
Volvo will Accelerate Forward into Electric and Autonomous Leadership in Five Years
Fair Value SEK 438.80|39.7% undervalued
UN
Community Contributor