
Advertisement
A Look At The Intrinsic Value Of Bhandari Hosiery Exports Limited (NSE:BHANDARI)

Key Insights
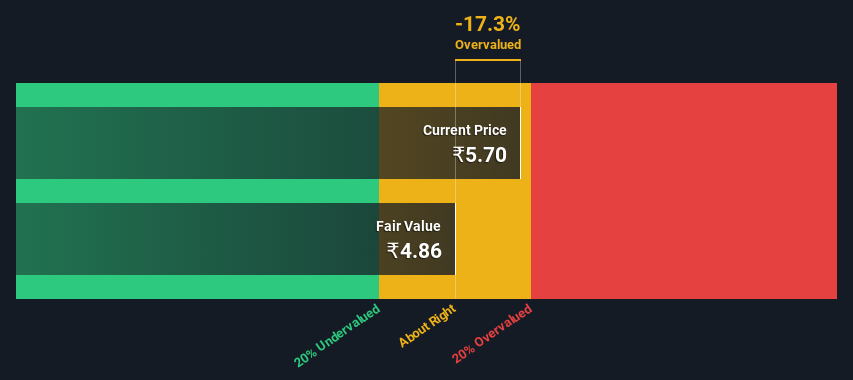
- Bhandari Hosiery Exports' estimated fair value is ₹4.86 based on 2 Stage Free Cash Flow to Equity
- Current share price of ₹5.70 suggests Bhandari Hosiery Exports is potentially trading close to its fair value
- When compared to theindustry average discount of -1,536%, Bhandari Hosiery Exports' competitors seem to be trading at a greater premium to fair value
How far off is Bhandari Hosiery Exports Limited (NSE:BHANDARI) from its intrinsic value? Using the most recent financial data, we'll take a look at whether the stock is fairly priced by projecting its future cash flows and then discounting them to today's value. This will be done using the Discounted Cash Flow (DCF) model. Models like these may appear beyond the comprehension of a lay person, but they're fairly easy to follow.
Companies can be valued in a lot of ways, so we would point out that a DCF is not perfect for every situation. If you want to learn more about discounted cash flow, the rationale behind this calculation can be read in detail in the Simply Wall St analysis model.
View our latest analysis for Bhandari Hosiery Exports
The Method
We use what is known as a 2-stage model, which simply means we have two different periods of growth rates for the company's cash flows. Generally the first stage is higher growth, and the second stage is a lower growth phase. To begin with, we have to get estimates of the next ten years of cash flows. Seeing as no analyst estimates of free cash flow are available to us, we have extrapolate the previous free cash flow (FCF) from the company's last reported value. We assume companies with shrinking free cash flow will slow their rate of shrinkage, and that companies with growing free cash flow will see their growth rate slow, over this period. We do this to reflect that growth tends to slow more in the early years than it does in later years.
Generally we assume that a dollar today is more valuable than a dollar in the future, so we discount the value of these future cash flows to their estimated value in today's dollars:
10-year free cash flow (FCF) estimate
| 2024 | 2025 | 2026 | 2027 | 2028 | 2029 | 2030 | 2031 | 2032 | 2033 | |
| Levered FCF (₹, Millions) | ₹98.7m | ₹109.1m | ₹119.4m | ₹129.7m | ₹140.1m | ₹150.9m | ₹162.1m | ₹173.7m | ₹186.0m | ₹199.0m |
| Growth Rate Estimate Source | Est @ 12.20% | Est @ 10.57% | Est @ 9.42% | Est @ 8.62% | Est @ 8.07% | Est @ 7.67% | Est @ 7.40% | Est @ 7.21% | Est @ 7.07% | Est @ 6.98% |
| Present Value (₹, Millions) Discounted @ 20% | ₹82.0 | ₹75.4 | ₹68.6 | ₹61.9 | ₹55.6 | ₹49.8 | ₹44.4 | ₹39.6 | ₹35.3 | ₹31.4 |
("Est" = FCF growth rate estimated by Simply Wall St)
Present Value of 10-year Cash Flow (PVCF) = ₹544m
The second stage is also known as Terminal Value, this is the business's cash flow after the first stage. The Gordon Growth formula is used to calculate Terminal Value at a future annual growth rate equal to the 5-year average of the 10-year government bond yield of 6.8%. We discount the terminal cash flows to today's value at a cost of equity of 20%.
Terminal Value (TV)= FCF2033 × (1 + g) ÷ (r – g) = ₹199m× (1 + 6.8%) ÷ (20%– 6.8%) = ₹1.6b
Present Value of Terminal Value (PVTV)= TV / (1 + r)10= ₹1.6b÷ ( 1 + 20%)10= ₹247m
The total value, or equity value, is then the sum of the present value of the future cash flows, which in this case is ₹791m. In the final step we divide the equity value by the number of shares outstanding. Relative to the current share price of ₹5.7, the company appears around fair value at the time of writing. Remember though, that this is just an approximate valuation, and like any complex formula - garbage in, garbage out.
The Assumptions
We would point out that the most important inputs to a discounted cash flow are the discount rate and of course the actual cash flows. If you don't agree with these result, have a go at the calculation yourself and play with the assumptions. The DCF also does not consider the possible cyclicality of an industry, or a company's future capital requirements, so it does not give a full picture of a company's potential performance. Given that we are looking at Bhandari Hosiery Exports as potential shareholders, the cost of equity is used as the discount rate, rather than the cost of capital (or weighted average cost of capital, WACC) which accounts for debt. In this calculation we've used 20%, which is based on a levered beta of 1.625. Beta is a measure of a stock's volatility, compared to the market as a whole. We get our beta from the industry average beta of globally comparable companies, with an imposed limit between 0.8 and 2.0, which is a reasonable range for a stable business.
SWOT Analysis for Bhandari Hosiery Exports
Strength
- Earnings growth over the past year exceeded the industry.
- Dividends are covered by earnings and cash flows.
Weakness
- Earnings growth over the past year is below its 5-year average.
- Interest payments on debt are not well covered.
- Dividend is low compared to the top 25% of dividend payers in the Luxury market.
- Current share price is above our estimate of fair value.
- Shareholders have been diluted in the past year.
Opportunity
- BHANDARI's financial characteristics indicate limited near-term opportunities for shareholders.
- Lack of analyst coverage makes it difficult to determine BHANDARI's earnings prospects.
Threat
- Debt is not well covered by operating cash flow.
Looking Ahead:
Whilst important, the DCF calculation shouldn't be the only metric you look at when researching a company. It's not possible to obtain a foolproof valuation with a DCF model. Rather it should be seen as a guide to "what assumptions need to be true for this stock to be under/overvalued?" For instance, if the terminal value growth rate is adjusted slightly, it can dramatically alter the overall result. For Bhandari Hosiery Exports, there are three important elements you should further examine:
- Risks: Every company has them, and we've spotted 4 warning signs for Bhandari Hosiery Exports (of which 2 can't be ignored!) you should know about.
- Other High Quality Alternatives: Do you like a good all-rounder? Explore our interactive list of high quality stocks to get an idea of what else is out there you may be missing!
- Other Environmentally-Friendly Companies: Concerned about the environment and think consumers will buy eco-friendly products more and more? Browse through our interactive list of companies that are thinking about a greener future to discover some stocks you may not have thought of!
PS. The Simply Wall St app conducts a discounted cash flow valuation for every stock on the NSEI every day. If you want to find the calculation for other stocks just search here.
Valuation is complex, but we're here to simplify it.
Discover if Bhandari Hosiery Exports might be undervalued or overvalued with our detailed analysis, featuring fair value estimates, potential risks, dividends, insider trades, and its financial condition.
Access Free AnalysisHave feedback on this article? Concerned about the content? Get in touch with us directly. Alternatively, email editorial-team (at) simplywallst.com.
This article by Simply Wall St is general in nature. We provide commentary based on historical data and analyst forecasts only using an unbiased methodology and our articles are not intended to be financial advice. It does not constitute a recommendation to buy or sell any stock, and does not take account of your objectives, or your financial situation. We aim to bring you long-term focused analysis driven by fundamental data. Note that our analysis may not factor in the latest price-sensitive company announcements or qualitative material. Simply Wall St has no position in any stocks mentioned.
About NSEI:BHANDARI
Bhandari Hosiery Exports
Operates as a textile and garments manufacturing company in India and internationally.
Good value with adequate balance sheet.
Market Insights

Advertisement
Community Narratives
Groundbreaking therapies that could change the treatment landscape for PTSD, fibromyalgia, MS & Alzheimer’s
Fair Value US$6.20|86.9% undervalued
CM
Community Contributor
DigitalOcean Will Grow 14% by Embracing AI with Paperspace Acquisition
Fair Value US$50.00|40.2% undervalued
NE
Community Contributor
Viant Technology: A Rising AdTech Challenger in the AI-Powered CTV Market
Fair Value US$38.61|62.7% undervalued
BL
Community Contributor
Volvo will Accelerate Forward into Electric and Autonomous Leadership in Five Years
Fair Value SEK 438.80|39.7% undervalued
UN
Community Contributor