
Advertisement
Warren Buffett famously said, 'Volatility is far from synonymous with risk.' So it might be obvious that you need to consider debt, when you think about how risky any given stock is, because too much debt can sink a company. Importantly, Ashima Limited (NSE:ASHIMASYN) does carry debt. But is this debt a concern to shareholders?
When Is Debt A Problem?
Debt assists a business until the business has trouble paying it off, either with new capital or with free cash flow. If things get really bad, the lenders can take control of the business. However, a more common (but still painful) scenario is that it has to raise new equity capital at a low price, thus permanently diluting shareholders. Having said that, the most common situation is where a company manages its debt reasonably well - and to its own advantage. The first thing to do when considering how much debt a business uses is to look at its cash and debt together.
Check out our latest analysis for Ashima
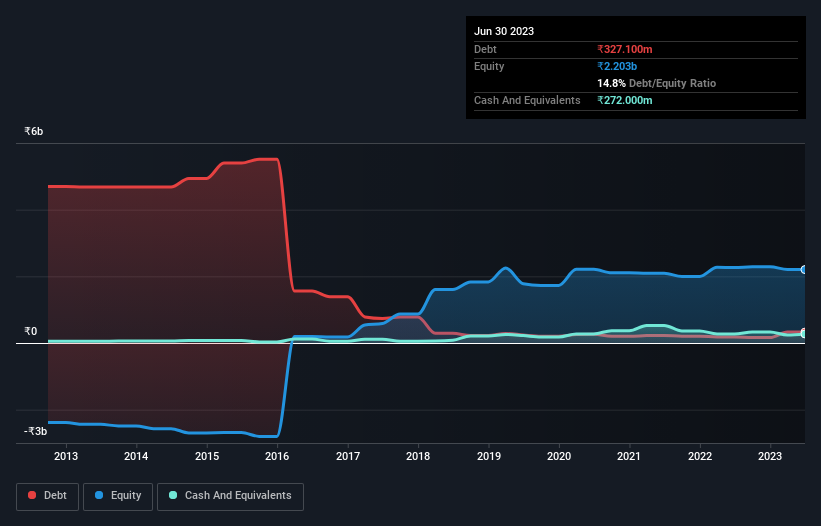
How Much Debt Does Ashima Carry?
You can click the graphic below for the historical numbers, but it shows that as of March 2023 Ashima had ₹327.1m of debt, an increase on ₹181.5m, over one year. On the flip side, it has ₹272.0m in cash leading to net debt of about ₹55.1m.
How Healthy Is Ashima's Balance Sheet?
Zooming in on the latest balance sheet data, we can see that Ashima had liabilities of ₹671.3m due within 12 months and liabilities of ₹327.7m due beyond that. Offsetting these obligations, it had cash of ₹272.0m as well as receivables valued at ₹167.8m due within 12 months. So its liabilities outweigh the sum of its cash and (near-term) receivables by ₹559.2m.
Of course, Ashima has a market capitalization of ₹2.93b, so these liabilities are probably manageable. Having said that, it's clear that we should continue to monitor its balance sheet, lest it change for the worse. The balance sheet is clearly the area to focus on when you are analysing debt. But it is Ashima's earnings that will influence how the balance sheet holds up in the future. So if you're keen to discover more about its earnings, it might be worth checking out this graph of its long term earnings trend.
Over 12 months, Ashima made a loss at the EBIT level, and saw its revenue drop to ₹2.0b, which is a fall of 19%. We would much prefer see growth.
Caveat Emptor
While Ashima's falling revenue is about as heartwarming as a wet blanket, arguably its earnings before interest and tax (EBIT) loss is even less appealing. Indeed, it lost ₹78m at the EBIT level. Considering that alongside the liabilities mentioned above does not give us much confidence that company should be using so much debt. Quite frankly we think the balance sheet is far from match-fit, although it could be improved with time. However, it doesn't help that it burned through ₹421m of cash over the last year. So in short it's a really risky stock. The balance sheet is clearly the area to focus on when you are analysing debt. However, not all investment risk resides within the balance sheet - far from it. We've identified 2 warning signs with Ashima (at least 1 which is a bit unpleasant) , and understanding them should be part of your investment process.
At the end of the day, it's often better to focus on companies that are free from net debt. You can access our special list of such companies (all with a track record of profit growth). It's free.
New: Manage All Your Stock Portfolios in One Place
We've created the ultimate portfolio companion for stock investors, and it's free.
• Connect an unlimited number of Portfolios and see your total in one currency
• Be alerted to new Warning Signs or Risks via email or mobile
• Track the Fair Value of your stocks
Have feedback on this article? Concerned about the content? Get in touch with us directly. Alternatively, email editorial-team (at) simplywallst.com.
This article by Simply Wall St is general in nature. We provide commentary based on historical data and analyst forecasts only using an unbiased methodology and our articles are not intended to be financial advice. It does not constitute a recommendation to buy or sell any stock, and does not take account of your objectives, or your financial situation. We aim to bring you long-term focused analysis driven by fundamental data. Note that our analysis may not factor in the latest price-sensitive company announcements or qualitative material. Simply Wall St has no position in any stocks mentioned.
About NSEI:ASHIMASYN
Mediocre balance sheet with very low risk.
Similar Companies
Market Insights

Advertisement
Community Narratives
Kodiak AI - a potential 100 bagger opportunity?
Fair Value US$14.00|44.7% undervalued
DA
Community Contributor
A Fair Price for a Great Business Facing Real Threats
Fair Value US$383.06|13.0% undervalued
IM
Community Contributor
AXON And Shopify Integration Will Unlock Global Mobile Advertising
Fair Value US$646.30|0% overvalued
AN
Based on Analyst Price Targets