Revenues Tell The Story For Ashima Limited (NSE:ASHIMASYN) As Its Stock Soars 27%


Ashima Limited (NSE:ASHIMASYN) shareholders would be excited to see that the share price has had a great month, posting a 27% gain and recovering from prior weakness. The last 30 days bring the annual gain to a very sharp 67%.
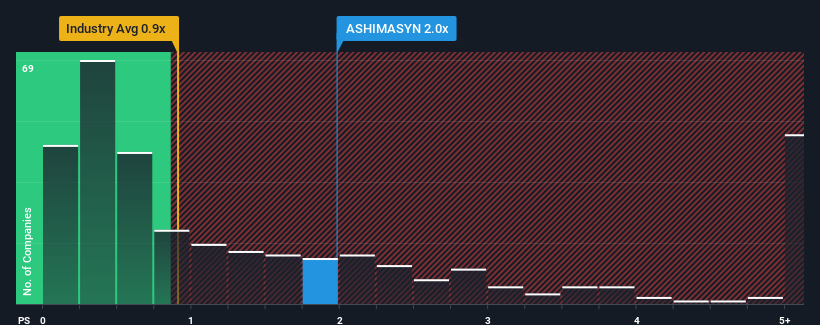
Since its price has surged higher, when almost half of the companies in India's Luxury industry have price-to-sales ratios (or "P/S") below 0.9x, you may consider Ashima as a stock probably not worth researching with its 2x P/S ratio. Nonetheless, we'd need to dig a little deeper to determine if there is a rational basis for the elevated P/S.
View our latest analysis for Ashima
What Does Ashima's Recent Performance Look Like?
As an illustration, revenue has deteriorated at Ashima over the last year, which is not ideal at all. It might be that many expect the company to still outplay most other companies over the coming period, which has kept the P/S from collapsing. You'd really hope so, otherwise you're paying a pretty hefty price for no particular reason.
We don't have analyst forecasts, but you can see how recent trends are setting up the company for the future by checking out our free report on Ashima's earnings, revenue and cash flow.What Are Revenue Growth Metrics Telling Us About The High P/S?
The only time you'd be truly comfortable seeing a P/S as high as Ashima's is when the company's growth is on track to outshine the industry.
Taking a look back first, the company's revenue growth last year wasn't something to get excited about as it posted a disappointing decline of 2.6%. However, a few very strong years before that means that it was still able to grow revenue by an impressive 47% in total over the last three years. Although it's been a bumpy ride, it's still fair to say the revenue growth recently has been more than adequate for the company.
Comparing that recent medium-term revenue trajectory with the industry's one-year growth forecast of 12% shows it's noticeably more attractive.
With this in consideration, it's not hard to understand why Ashima's P/S is high relative to its industry peers. Presumably shareholders aren't keen to offload something they believe will continue to outmanoeuvre the wider industry.
The Key Takeaway
Ashima's P/S is on the rise since its shares have risen strongly. It's argued the price-to-sales ratio is an inferior measure of value within certain industries, but it can be a powerful business sentiment indicator.
We've established that Ashima maintains its high P/S on the strength of its recent three-year growth being higher than the wider industry forecast, as expected. At this stage investors feel the potential continued revenue growth in the future is great enough to warrant an inflated P/S. Unless the recent medium-term conditions change, they will continue to provide strong support to the share price.
There are also other vital risk factors to consider and we've discovered 2 warning signs for Ashima (1 is a bit unpleasant!) that you should be aware of before investing here.
Of course, profitable companies with a history of great earnings growth are generally safer bets. So you may wish to see this free collection of other companies that have reasonable P/E ratios and have grown earnings strongly.
If you're looking to trade Ashima, open an account with the lowest-cost platform trusted by professionals, Interactive Brokers.
With clients in over 200 countries and territories, and access to 160 markets, IBKR lets you trade stocks, options, futures, forex, bonds and funds from a single integrated account.
Enjoy no hidden fees, no account minimums, and FX conversion rates as low as 0.03%, far better than what most brokers offer.
Sponsored ContentNew: Manage All Your Stock Portfolios in One Place
We've created the ultimate portfolio companion for stock investors, and it's free.
• Connect an unlimited number of Portfolios and see your total in one currency
• Be alerted to new Warning Signs or Risks via email or mobile
• Track the Fair Value of your stocks
Have feedback on this article? Concerned about the content? Get in touch with us directly. Alternatively, email editorial-team (at) simplywallst.com.
This article by Simply Wall St is general in nature. We provide commentary based on historical data and analyst forecasts only using an unbiased methodology and our articles are not intended to be financial advice. It does not constitute a recommendation to buy or sell any stock, and does not take account of your objectives, or your financial situation. We aim to bring you long-term focused analysis driven by fundamental data. Note that our analysis may not factor in the latest price-sensitive company announcements or qualitative material. Simply Wall St has no position in any stocks mentioned.
About NSEI:ASHIMASYN
Ashima
Manufactures and sells denim fabrics and readymade garments in India.
Proven track record with adequate balance sheet.
Similar Companies
Market Insights

Community Narratives

