Ashima Limited (NSE:ASHIMASYN) Shares Slammed 29% But Getting In Cheap Might Be Difficult Regardless

Ashima Limited (NSE:ASHIMASYN) shareholders won't be pleased to see that the share price has had a very rough month, dropping 29% and undoing the prior period's positive performance. Of course, over the longer-term many would still wish they owned shares as the stock's price has soared 139% in the last twelve months.
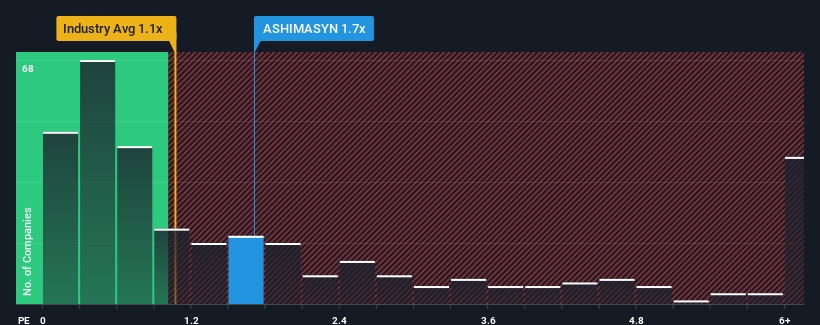
Even after such a large drop in price, you could still be forgiven for thinking Ashima is a stock not worth researching with a price-to-sales ratios (or "P/S") of 1.7x, considering almost half the companies in India's Luxury industry have P/S ratios below 1.1x. However, the P/S might be high for a reason and it requires further investigation to determine if it's justified.
Check out our latest analysis for Ashima
How Has Ashima Performed Recently?
With revenue growth that's exceedingly strong of late, Ashima has been doing very well. Perhaps the market is expecting future revenue performance to outperform the wider market, which has seemingly got people interested in the stock. If not, then existing shareholders might be a little nervous about the viability of the share price.
Although there are no analyst estimates available for Ashima, take a look at this free data-rich visualisation to see how the company stacks up on earnings, revenue and cash flow.Do Revenue Forecasts Match The High P/S Ratio?
The only time you'd be truly comfortable seeing a P/S as high as Ashima's is when the company's growth is on track to outshine the industry.
Retrospectively, the last year delivered an exceptional 78% gain to the company's top line. Pleasingly, revenue has also lifted 121% in aggregate from three years ago, thanks to the last 12 months of growth. Therefore, it's fair to say the revenue growth recently has been superb for the company.
This is in contrast to the rest of the industry, which is expected to grow by 13% over the next year, materially lower than the company's recent medium-term annualised growth rates.
With this information, we can see why Ashima is trading at such a high P/S compared to the industry. Presumably shareholders aren't keen to offload something they believe will continue to outmanoeuvre the wider industry.
What We Can Learn From Ashima's P/S?
There's still some elevation in Ashima's P/S, even if the same can't be said for its share price recently. Typically, we'd caution against reading too much into price-to-sales ratios when settling on investment decisions, though it can reveal plenty about what other market participants think about the company.
As we suspected, our examination of Ashima revealed its three-year revenue trends are contributing to its high P/S, given they look better than current industry expectations. In the eyes of shareholders, the probability of a continued growth trajectory is great enough to prevent the P/S from pulling back. Barring any significant changes to the company's ability to make money, the share price should continue to be propped up.
It's always necessary to consider the ever-present spectre of investment risk. We've identified 2 warning signs with Ashima, and understanding these should be part of your investment process.
It's important to make sure you look for a great company, not just the first idea you come across. So if growing profitability aligns with your idea of a great company, take a peek at this free list of interesting companies with strong recent earnings growth (and a low P/E).
If you're looking to trade Ashima, open an account with the lowest-cost platform trusted by professionals, Interactive Brokers.
With clients in over 200 countries and territories, and access to 160 markets, IBKR lets you trade stocks, options, futures, forex, bonds and funds from a single integrated account.
Enjoy no hidden fees, no account minimums, and FX conversion rates as low as 0.03%, far better than what most brokers offer.
Sponsored ContentNew: Manage All Your Stock Portfolios in One Place
We've created the ultimate portfolio companion for stock investors, and it's free.
• Connect an unlimited number of Portfolios and see your total in one currency
• Be alerted to new Warning Signs or Risks via email or mobile
• Track the Fair Value of your stocks
Have feedback on this article? Concerned about the content? Get in touch with us directly. Alternatively, email editorial-team (at) simplywallst.com.
This article by Simply Wall St is general in nature. We provide commentary based on historical data and analyst forecasts only using an unbiased methodology and our articles are not intended to be financial advice. It does not constitute a recommendation to buy or sell any stock, and does not take account of your objectives, or your financial situation. We aim to bring you long-term focused analysis driven by fundamental data. Note that our analysis may not factor in the latest price-sensitive company announcements or qualitative material. Simply Wall St has no position in any stocks mentioned.
About NSEI:ASHIMASYN
Ashima
Manufactures and sells denim fabrics and readymade garments in India.
Proven track record with adequate balance sheet.
Similar Companies
Market Insights

Community Narratives

