
Advertisement
- India
- /
- Consumer Durables
- /
- NSEI:AMBER
Returns On Capital At Amber Enterprises India (NSE:AMBER) Have Hit The Brakes

What trends should we look for it we want to identify stocks that can multiply in value over the long term? Firstly, we'd want to identify a growing return on capital employed (ROCE) and then alongside that, an ever-increasing base of capital employed. Put simply, these types of businesses are compounding machines, meaning they are continually reinvesting their earnings at ever-higher rates of return. So, when we ran our eye over Amber Enterprises India's (NSE:AMBER) trend of ROCE, we liked what we saw.
Return On Capital Employed (ROCE): What Is It?
For those who don't know, ROCE is a measure of a company's yearly pre-tax profit (its return), relative to the capital employed in the business. Analysts use this formula to calculate it for Amber Enterprises India:
Return on Capital Employed = Earnings Before Interest and Tax (EBIT) ÷ (Total Assets - Current Liabilities)
0.12 = ₹3.4b ÷ (₹46b - ₹19b) (Based on the trailing twelve months to September 2023).
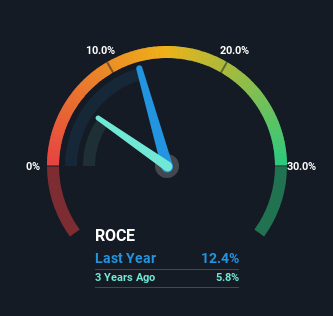
So, Amber Enterprises India has an ROCE of 12%. By itself that's a normal return on capital and it's in line with the industry's average returns of 12%.
View our latest analysis for Amber Enterprises India
In the above chart we have measured Amber Enterprises India's prior ROCE against its prior performance, but the future is arguably more important. If you'd like to see what analysts are forecasting going forward, you should check out our free report for Amber Enterprises India.
What The Trend Of ROCE Can Tell Us
The trend of ROCE doesn't stand out much, but returns on a whole are decent. The company has employed 146% more capital in the last five years, and the returns on that capital have remained stable at 12%. 12% is a pretty standard return, and it provides some comfort knowing that Amber Enterprises India has consistently earned this amount. Over long periods of time, returns like these might not be too exciting, but with consistency they can pay off in terms of share price returns.
On a separate but related note, it's important to know that Amber Enterprises India has a current liabilities to total assets ratio of 41%, which we'd consider pretty high. This effectively means that suppliers (or short-term creditors) are funding a large portion of the business, so just be aware that this can introduce some elements of risk. Ideally we'd like to see this reduce as that would mean fewer obligations bearing risks.
In Conclusion...
The main thing to remember is that Amber Enterprises India has proven its ability to continually reinvest at respectable rates of return. On top of that, the stock has rewarded shareholders with a remarkable 245% return to those who've held over the last five years. So while the positive underlying trends may be accounted for by investors, we still think this stock is worth looking into further.
If you'd like to know about the risks facing Amber Enterprises India, we've discovered 1 warning sign that you should be aware of.
While Amber Enterprises India isn't earning the highest return, check out this free list of companies that are earning high returns on equity with solid balance sheets.
New: Manage All Your Stock Portfolios in One Place
We've created the ultimate portfolio companion for stock investors, and it's free.
• Connect an unlimited number of Portfolios and see your total in one currency
• Be alerted to new Warning Signs or Risks via email or mobile
• Track the Fair Value of your stocks
Have feedback on this article? Concerned about the content? Get in touch with us directly. Alternatively, email editorial-team (at) simplywallst.com.
This article by Simply Wall St is general in nature. We provide commentary based on historical data and analyst forecasts only using an unbiased methodology and our articles are not intended to be financial advice. It does not constitute a recommendation to buy or sell any stock, and does not take account of your objectives, or your financial situation. We aim to bring you long-term focused analysis driven by fundamental data. Note that our analysis may not factor in the latest price-sensitive company announcements or qualitative material. Simply Wall St has no position in any stocks mentioned.
About NSEI:AMBER
Amber Enterprises India
Provides room air conditioner solutions in India.
Solid track record with reasonable growth potential.
Market Insights

Advertisement
Community Narratives

BMW cruising ahead with new EVs and premium models to boost revenue 5%
Fair Value €135.07|44.5% undervalued
UN
Community Contributor
EU#2 - From Humble Beginnings to Global Powerhouse
Fair Value DKK 851.04|46.1% undervalued
TO
Community Contributor