- India
- /
- Consumer Durables
- /
- NSEI:AMBER
Investors Will Want Amber Enterprises India's (NSE:AMBER) Growth In ROCE To Persist


If we want to find a stock that could multiply over the long term, what are the underlying trends we should look for? Firstly, we'll want to see a proven return on capital employed (ROCE) that is increasing, and secondly, an expanding base of capital employed. This shows us that it's a compounding machine, able to continually reinvest its earnings back into the business and generate higher returns. So on that note, Amber Enterprises India (NSE:AMBER) looks quite promising in regards to its trends of return on capital.
Understanding Return On Capital Employed (ROCE)
For those who don't know, ROCE is a measure of a company's yearly pre-tax profit (its return), relative to the capital employed in the business. The formula for this calculation on Amber Enterprises India is:
Return on Capital Employed = Earnings Before Interest and Tax (EBIT) ÷ (Total Assets - Current Liabilities)
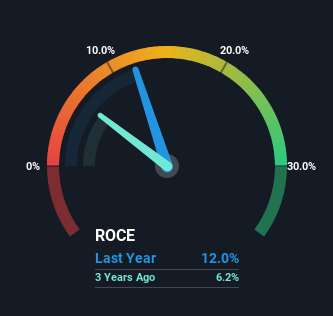
0.12 = ₹3.3b ÷ (₹46b - ₹19b) (Based on the trailing twelve months to December 2023).
Thus, Amber Enterprises India has an ROCE of 12%. That's a relatively normal return on capital, and it's around the 13% generated by the Consumer Durables industry.
View our latest analysis for Amber Enterprises India
Above you can see how the current ROCE for Amber Enterprises India compares to its prior returns on capital, but there's only so much you can tell from the past. If you're interested, you can view the analysts predictions in our free analyst report for Amber Enterprises India .
So How Is Amber Enterprises India's ROCE Trending?
The trends we've noticed at Amber Enterprises India are quite reassuring. The data shows that returns on capital have increased substantially over the last five years to 12%. The amount of capital employed has increased too, by 146%. The increasing returns on a growing amount of capital is common amongst multi-baggers and that's why we're impressed.
On a side note, Amber Enterprises India's current liabilities are still rather high at 41% of total assets. This can bring about some risks because the company is basically operating with a rather large reliance on its suppliers or other sorts of short-term creditors. Ideally we'd like to see this reduce as that would mean fewer obligations bearing risks.
The Key Takeaway
In summary, it's great to see that Amber Enterprises India can compound returns by consistently reinvesting capital at increasing rates of return, because these are some of the key ingredients of those highly sought after multi-baggers. And with the stock having performed exceptionally well over the last five years, these patterns are being accounted for by investors. Therefore, we think it would be worth your time to check if these trends are going to continue.
Amber Enterprises India does come with some risks though, we found 2 warning signs in our investment analysis, and 1 of those is significant...
If you want to search for solid companies with great earnings, check out this free list of companies with good balance sheets and impressive returns on equity.
New: Manage All Your Stock Portfolios in One Place
We've created the ultimate portfolio companion for stock investors, and it's free.
• Connect an unlimited number of Portfolios and see your total in one currency
• Be alerted to new Warning Signs or Risks via email or mobile
• Track the Fair Value of your stocks
Have feedback on this article? Concerned about the content? Get in touch with us directly. Alternatively, email editorial-team (at) simplywallst.com.
This article by Simply Wall St is general in nature. We provide commentary based on historical data and analyst forecasts only using an unbiased methodology and our articles are not intended to be financial advice. It does not constitute a recommendation to buy or sell any stock, and does not take account of your objectives, or your financial situation. We aim to bring you long-term focused analysis driven by fundamental data. Note that our analysis may not factor in the latest price-sensitive company announcements or qualitative material. Simply Wall St has no position in any stocks mentioned.
About NSEI:AMBER
Amber Enterprises India
Provides room air conditioner solutions in India.
Solid track record with reasonable growth potential.
Market Insights

Community Narratives

