- India
- /
- Professional Services
- /
- NSEI:TEAMLEASE
TeamLease Services (NSE:TEAMLEASE) Is Posting Promising Earnings But The Good News Doesn’t Stop There


The market seemed underwhelmed by last week's earnings announcement from TeamLease Services Limited (NSE:TEAMLEASE) despite the healthy numbers. We did some analysis to find out why and believe that investors might be missing some encouraging factors contained in the earnings.
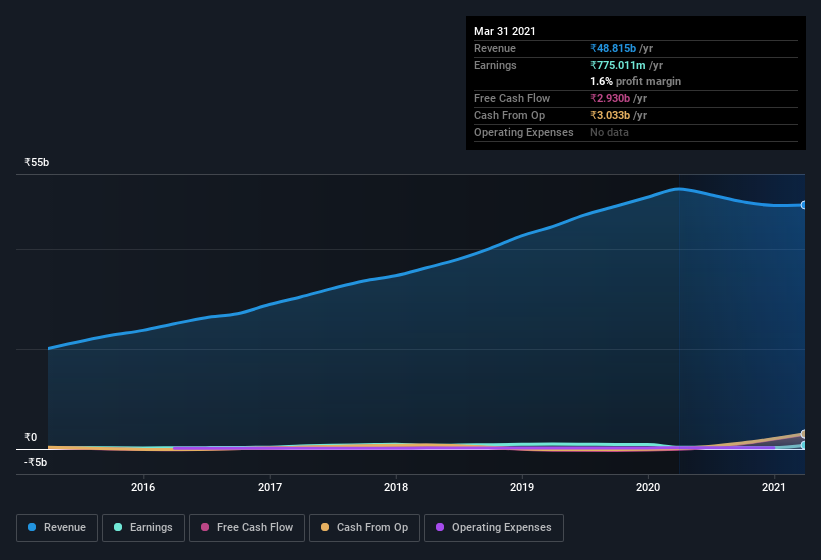
Check out our latest analysis for TeamLease Services
Zooming In On TeamLease Services' Earnings
In high finance, the key ratio used to measure how well a company converts reported profits into free cash flow (FCF) is the accrual ratio (from cashflow). To get the accrual ratio we first subtract FCF from profit for a period, and then divide that number by the average operating assets for the period. This ratio tells us how much of a company's profit is not backed by free cashflow.
Therefore, it's actually considered a good thing when a company has a negative accrual ratio, but a bad thing if its accrual ratio is positive. While having an accrual ratio above zero is of little concern, we do think it's worth noting when a company has a relatively high accrual ratio. Notably, there is some academic evidence that suggests that a high accrual ratio is a bad sign for near-term profits, generally speaking.
For the year to March 2021, TeamLease Services had an accrual ratio of -0.51. That implies it has very good cash conversion, and that its earnings in the last year actually significantly understate its free cash flow. To wit, it produced free cash flow of ₹2.9b during the period, dwarfing its reported profit of ₹775.0m. Given that TeamLease Services had negative free cash flow in the prior corresponding period, the trailing twelve month resul of ₹2.9b would seem to be a step in the right direction.
That might leave you wondering what analysts are forecasting in terms of future profitability. Luckily, you can click here to see an interactive graph depicting future profitability, based on their estimates.
Our Take On TeamLease Services' Profit Performance
Happily for shareholders, TeamLease Services produced plenty of free cash flow to back up its statutory profit numbers. Based on this observation, we consider it possible that TeamLease Services' statutory profit actually understates its earnings potential! And on top of that, its earnings per share have grown at an extremely impressive rate over the last year. At the end of the day, it's essential to consider more than just the factors above, if you want to understand the company properly. While it's really important to consider how well a company's statutory earnings represent its true earnings power, it's also worth taking a look at what analysts are forecasting for the future. At Simply Wall St, we have analyst estimates which you can view by clicking here.
Today we've zoomed in on a single data point to better understand the nature of TeamLease Services' profit. But there are plenty of other ways to inform your opinion of a company. For example, many people consider a high return on equity as an indication of favorable business economics, while others like to 'follow the money' and search out stocks that insiders are buying. While it might take a little research on your behalf, you may find this free collection of companies boasting high return on equity, or this list of stocks that insiders are buying to be useful.
When trading TeamLease Services or any other investment, use the platform considered by many to be the Professional's Gateway to the Worlds Market, Interactive Brokers. You get the lowest-cost* trading on stocks, options, futures, forex, bonds and funds worldwide from a single integrated account. Promoted
Valuation is complex, but we're here to simplify it.
Discover if TeamLease Services might be undervalued or overvalued with our detailed analysis, featuring fair value estimates, potential risks, dividends, insider trades, and its financial condition.
Access Free AnalysisThis article by Simply Wall St is general in nature. It does not constitute a recommendation to buy or sell any stock, and does not take account of your objectives, or your financial situation. We aim to bring you long-term focused analysis driven by fundamental data. Note that our analysis may not factor in the latest price-sensitive company announcements or qualitative material. Simply Wall St has no position in any stocks mentioned.
*Interactive Brokers Rated Lowest Cost Broker by StockBrokers.com Annual Online Review 2020
Have feedback on this article? Concerned about the content? Get in touch with us directly. Alternatively, email editorial-team (at) simplywallst.com.
About NSEI:TEAMLEASE
TeamLease Services
Engages in human resource services to various industries in India and internationally.
Flawless balance sheet with reasonable growth potential.

