
Advertisement
- India
- /
- Professional Services
- /
- NSEI:AARVI
Aarvi Encon (NSE:AARVI) Is Growing Earnings But Are They A Good Guide?
It might be old fashioned, but we really like to invest in companies that make a profit, each and every year. That said, the current statutory profit is not always a good guide to a company's underlying profitability. Today we'll focus on whether this year's statutory profits are a good guide to understanding Aarvi Encon (NSE:AARVI).
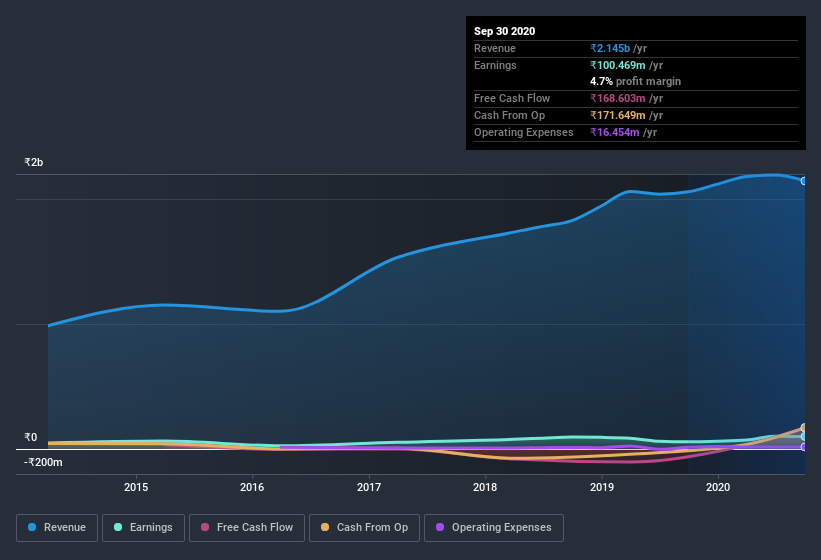
It's good to see that over the last twelve months Aarvi Encon made a profit of ₹100.5m on revenue of ₹2.14b. In the chart below, you can see that its profit and revenue have both grown over the last three years.
View our latest analysis for Aarvi Encon
Importantly, statutory profits are not always the best tool for understanding a company's true earnings power, so it's well worth examining profits in a little more detail. As a result, we think it's well worth considering what Aarvi Encon's cashflow (when compared to its earnings) can tell us about the nature of its statutory profit. Note: we always recommend investors check balance sheet strength. Click here to be taken to our balance sheet analysis of Aarvi Encon.
Zooming In On Aarvi Encon's Earnings
Many investors haven't heard of the accrual ratio from cashflow, but it is actually a useful measure of how well a company's profit is backed up by free cash flow (FCF) during a given period. In plain english, this ratio subtracts FCF from net profit, and divides that number by the company's average operating assets over that period. You could think of the accrual ratio from cashflow as the 'non-FCF profit ratio'.
That means a negative accrual ratio is a good thing, because it shows that the company is bringing in more free cash flow than its profit would suggest. While having an accrual ratio above zero is of little concern, we do think it's worth noting when a company has a relatively high accrual ratio. Notably, there is some academic evidence that suggests that a high accrual ratio is a bad sign for near-term profits, generally speaking.
Over the twelve months to September 2020, Aarvi Encon recorded an accrual ratio of -0.11. That indicates that its free cash flow was a fair bit more than its statutory profit. In fact, it had free cash flow of ₹169m in the last year, which was a lot more than its statutory profit of ₹100.5m. Notably, Aarvi Encon had negative free cash flow last year, so the ₹169m it produced this year was a welcome improvement.
Our Take On Aarvi Encon's Profit Performance
As we discussed above, Aarvi Encon has perfectly satisfactory free cash flow relative to profit. Because of this, we think Aarvi Encon's earnings potential is at least as good as it seems, and maybe even better! And the EPS is up 16% annually, over the last three years. At the end of the day, it's essential to consider more than just the factors above, if you want to understand the company properly. If you'd like to know more about Aarvi Encon as a business, it's important to be aware of any risks it's facing. In terms of investment risks, we've identified 3 warning signs with Aarvi Encon, and understanding these bad boys should be part of your investment process.
This note has only looked at a single factor that sheds light on the nature of Aarvi Encon's profit. But there are plenty of other ways to inform your opinion of a company. Some people consider a high return on equity to be a good sign of a quality business. So you may wish to see this free collection of companies boasting high return on equity, or this list of stocks that insiders are buying.
When trading Aarvi Encon or any other investment, use the platform considered by many to be the Professional's Gateway to the Worlds Market, Interactive Brokers. You get the lowest-cost* trading on stocks, options, futures, forex, bonds and funds worldwide from a single integrated account. Promoted
New: Manage All Your Stock Portfolios in One Place
We've created the ultimate portfolio companion for stock investors, and it's free.
• Connect an unlimited number of Portfolios and see your total in one currency
• Be alerted to new Warning Signs or Risks via email or mobile
• Track the Fair Value of your stocks
This article by Simply Wall St is general in nature. It does not constitute a recommendation to buy or sell any stock, and does not take account of your objectives, or your financial situation. We aim to bring you long-term focused analysis driven by fundamental data. Note that our analysis may not factor in the latest price-sensitive company announcements or qualitative material. Simply Wall St has no position in any stocks mentioned.
*Interactive Brokers Rated Lowest Cost Broker by StockBrokers.com Annual Online Review 2020
Have feedback on this article? Concerned about the content? Get in touch with us directly. Alternatively, email editorial-team (at) simplywallst.com.
About NSEI:AARVI
Aarvi Encon
A technical manpower supply company, provides permanent and temporary manpower services in India, Malaysia, Italy, and internationally.
Adequate balance sheet with acceptable track record.
Market Insights

Advertisement
Community Narratives
Finding The True Value Of A Logistics Powerhouse
Fair Value US$95.21|6.3% undervalued
NV
Community Contributor
Paradigm Biopharmaceuticals Will Lead Osteoarthritis Treatment with Zilosul's FDA Success
Fair Value AU$5.50|91.9% undervalued
AM
Community Contributor
Barrick Mining (ABX:CA): A Gold Hedge against a U.S. Shutdown
Fair Value CA$60.00|25.8% undervalued
GM
Community Contributor