
Advertisement

David Iben put it well when he said, 'Volatility is not a risk we care about. What we care about is avoiding the permanent loss of capital.' When we think about how risky a company is, we always like to look at its use of debt, since debt overload can lead to ruin. We note that Vesuvius India Limited (NSE:VESUVIUS) does have debt on its balance sheet. But is this debt a concern to shareholders?
What Risk Does Debt Bring?
Debt is a tool to help businesses grow, but if a business is incapable of paying off its lenders, then it exists at their mercy. Part and parcel of capitalism is the process of 'creative destruction' where failed businesses are mercilessly liquidated by their bankers. However, a more usual (but still expensive) situation is where a company must dilute shareholders at a cheap share price simply to get debt under control. Having said that, the most common situation is where a company manages its debt reasonably well - and to its own advantage. When we think about a company's use of debt, we first look at cash and debt together.
What Is Vesuvius India's Debt?
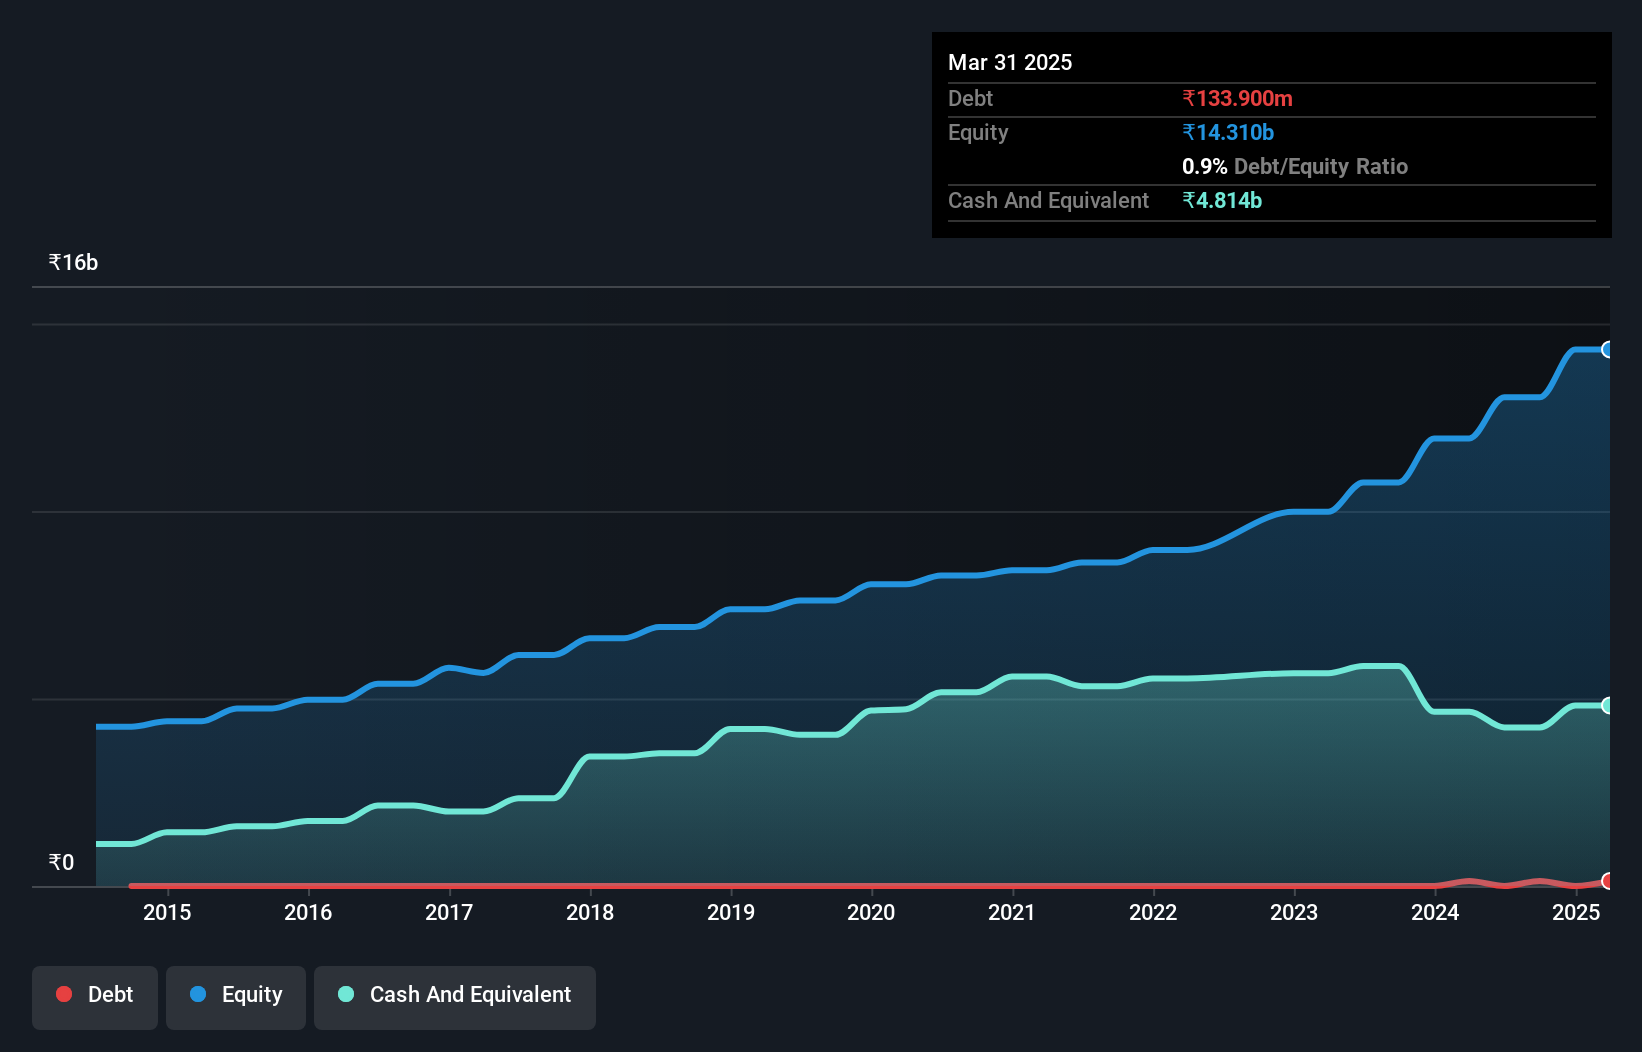
The chart below, which you can click on for greater detail, shows that Vesuvius India had ₹133.9m in debt in December 2024; about the same as the year before. However, it does have ₹4.81b in cash offsetting this, leading to net cash of ₹4.68b.
How Healthy Is Vesuvius India's Balance Sheet?
We can see from the most recent balance sheet that Vesuvius India had liabilities of ₹3.76b falling due within a year, and liabilities of ₹401.7m due beyond that. Offsetting these obligations, it had cash of ₹4.81b as well as receivables valued at ₹3.94b due within 12 months. So it can boast ₹4.60b more liquid assets than total liabilities.
This surplus suggests that Vesuvius India has a conservative balance sheet, and could probably eliminate its debt without much difficulty. Succinctly put, Vesuvius India boasts net cash, so it's fair to say it does not have a heavy debt load!
View our latest analysis for Vesuvius India
While Vesuvius India doesn't seem to have gained much on the EBIT line, at least earnings remain stable for now. The balance sheet is clearly the area to focus on when you are analysing debt. But it is future earnings, more than anything, that will determine Vesuvius India's ability to maintain a healthy balance sheet going forward. So if you're focused on the future you can check out this free report showing analyst profit forecasts.
Finally, a business needs free cash flow to pay off debt; accounting profits just don't cut it. While Vesuvius India has net cash on its balance sheet, it's still worth taking a look at its ability to convert earnings before interest and tax (EBIT) to free cash flow, to help us understand how quickly it is building (or eroding) that cash balance. Over the last three years, Vesuvius India reported free cash flow worth 4.0% of its EBIT, which is really quite low. For us, cash conversion that low sparks a little paranoia about is ability to extinguish debt.

Summing Up
While it is always sensible to investigate a company's debt, in this case Vesuvius India has ₹4.68b in net cash and a decent-looking balance sheet. So we don't have any problem with Vesuvius India's use of debt. Over time, share prices tend to follow earnings per share, so if you're interested in Vesuvius India, you may well want to click here to check an interactive graph of its earnings per share history.
At the end of the day, it's often better to focus on companies that are free from net debt. You can access our special list of such companies (all with a track record of profit growth). It's free.
New: Manage All Your Stock Portfolios in One Place
We've created the ultimate portfolio companion for stock investors, and it's free.
• Connect an unlimited number of Portfolios and see your total in one currency
• Be alerted to new Warning Signs or Risks via email or mobile
• Track the Fair Value of your stocks
Have feedback on this article? Concerned about the content? Get in touch with us directly. Alternatively, email editorial-team (at) simplywallst.com.
This article by Simply Wall St is general in nature. We provide commentary based on historical data and analyst forecasts only using an unbiased methodology and our articles are not intended to be financial advice. It does not constitute a recommendation to buy or sell any stock, and does not take account of your objectives, or your financial situation. We aim to bring you long-term focused analysis driven by fundamental data. Note that our analysis may not factor in the latest price-sensitive company announcements or qualitative material. Simply Wall St has no position in any stocks mentioned.
About NSEI:VESUVIUS
Excellent balance sheet with moderate growth potential.
Similar Companies
Market Insights

Advertisement
Community Narratives
WhiteCap Is Positioned To Profit Regardless Of Trump's Policy 
Fair Value CA$22.60|61.7% undervalued
ST
Equity Analyst and Writer
Microsoft's Evolution Will Drive Revenue to New Heights Fueled by AI
Fair Value US$360.00|28.9% overvalued
BR
Community Contributor
A CASE FOR USD$2.50 (CAD$3.44) BY 2028 (A 5-10 BAGGER)
Fair Value CA$3.44|88.1% undervalued
AG
Community Contributor