Even With A 40% Surge, Cautious Investors Are Not Rewarding Technocraft Industries (India) Limited's (NSE:TIIL) Performance Completely


Technocraft Industries (India) Limited (NSE:TIIL) shareholders would be excited to see that the share price has had a great month, posting a 40% gain and recovering from prior weakness. The last 30 days bring the annual gain to a very sharp 51%.
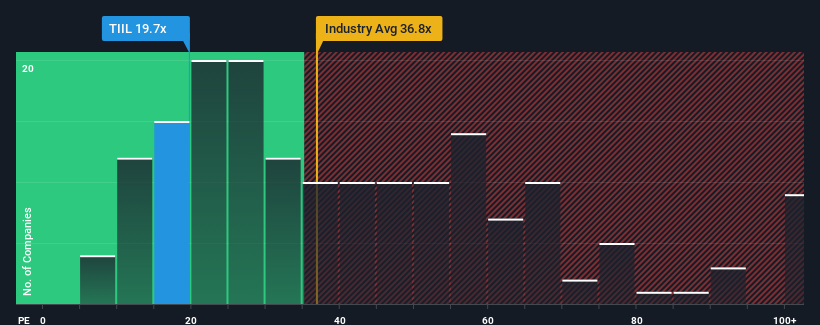
Even after such a large jump in price, Technocraft Industries (India)'s price-to-earnings (or "P/E") ratio of 19.7x might still make it look like a buy right now compared to the market in India, where around half of the companies have P/E ratios above 31x and even P/E's above 58x are quite common. Nonetheless, we'd need to dig a little deeper to determine if there is a rational basis for the reduced P/E.
As an illustration, earnings have deteriorated at Technocraft Industries (India) over the last year, which is not ideal at all. It might be that many expect the disappointing earnings performance to continue or accelerate, which has repressed the P/E. If you like the company, you'd be hoping this isn't the case so that you could potentially pick up some stock while it's out of favour.
Check out our latest analysis for Technocraft Industries (India)
What Are Growth Metrics Telling Us About The Low P/E?
There's an inherent assumption that a company should underperform the market for P/E ratios like Technocraft Industries (India)'s to be considered reasonable.
If we review the last year of earnings, dishearteningly the company's profits fell to the tune of 2.9%. Still, the latest three year period has seen an excellent 119% overall rise in EPS, in spite of its unsatisfying short-term performance. Accordingly, while they would have preferred to keep the run going, shareholders would probably welcome the medium-term rates of earnings growth.
Weighing that recent medium-term earnings trajectory against the broader market's one-year forecast for expansion of 24% shows it's noticeably more attractive on an annualised basis.
In light of this, it's peculiar that Technocraft Industries (India)'s P/E sits below the majority of other companies. Apparently some shareholders believe the recent performance has exceeded its limits and have been accepting significantly lower selling prices.
The Key Takeaway
Technocraft Industries (India)'s stock might have been given a solid boost, but its P/E certainly hasn't reached any great heights. Using the price-to-earnings ratio alone to determine if you should sell your stock isn't sensible, however it can be a practical guide to the company's future prospects.
We've established that Technocraft Industries (India) currently trades on a much lower than expected P/E since its recent three-year growth is higher than the wider market forecast. There could be some major unobserved threats to earnings preventing the P/E ratio from matching this positive performance. It appears many are indeed anticipating earnings instability, because the persistence of these recent medium-term conditions would normally provide a boost to the share price.
We don't want to rain on the parade too much, but we did also find 1 warning sign for Technocraft Industries (India) that you need to be mindful of.
If you're unsure about the strength of Technocraft Industries (India)'s business, why not explore our interactive list of stocks with solid business fundamentals for some other companies you may have missed.
If you're looking to trade Technocraft Industries (India), open an account with the lowest-cost platform trusted by professionals, Interactive Brokers.
With clients in over 200 countries and territories, and access to 160 markets, IBKR lets you trade stocks, options, futures, forex, bonds and funds from a single integrated account.
Enjoy no hidden fees, no account minimums, and FX conversion rates as low as 0.03%, far better than what most brokers offer.
Sponsored ContentValuation is complex, but we're here to simplify it.
Discover if Technocraft Industries (India) might be undervalued or overvalued with our detailed analysis, featuring fair value estimates, potential risks, dividends, insider trades, and its financial condition.
Access Free AnalysisHave feedback on this article? Concerned about the content? Get in touch with us directly. Alternatively, email editorial-team (at) simplywallst.com.
This article by Simply Wall St is general in nature. We provide commentary based on historical data and analyst forecasts only using an unbiased methodology and our articles are not intended to be financial advice. It does not constitute a recommendation to buy or sell any stock, and does not take account of your objectives, or your financial situation. We aim to bring you long-term focused analysis driven by fundamental data. Note that our analysis may not factor in the latest price-sensitive company announcements or qualitative material. Simply Wall St has no position in any stocks mentioned.
About NSEI:TIIL
Technocraft Industries (India)
Engages in scaffolding business in India and internationally.
Flawless balance sheet and slightly overvalued.
Similar Companies
Market Insights

Community Narratives

