
Advertisement
Thejo Engineering Limited's (NSE:THEJO) Fundamentals Look Pretty Strong: Could The Market Be Wrong About The Stock?
It is hard to get excited after looking at Thejo Engineering's (NSE:THEJO) recent performance, when its stock has declined 17% over the past month. However, stock prices are usually driven by a company’s financial performance over the long term, which in this case looks quite promising. Particularly, we will be paying attention to Thejo Engineering's ROE today.
Return on equity or ROE is a key measure used to assess how efficiently a company's management is utilizing the company's capital. Put another way, it reveals the company's success at turning shareholder investments into profits.
See our latest analysis for Thejo Engineering
How Is ROE Calculated?
The formula for return on equity is:
Return on Equity = Net Profit (from continuing operations) ÷ Shareholders' Equity
So, based on the above formula, the ROE for Thejo Engineering is:
24% = ₹385m ÷ ₹1.6b (Based on the trailing twelve months to September 2021).
The 'return' is the profit over the last twelve months. That means that for every ₹1 worth of shareholders' equity, the company generated ₹0.24 in profit.
What Is The Relationship Between ROE And Earnings Growth?
So far, we've learned that ROE is a measure of a company's profitability. We now need to evaluate how much profit the company reinvests or "retains" for future growth which then gives us an idea about the growth potential of the company. Assuming all else is equal, companies that have both a higher return on equity and higher profit retention are usually the ones that have a higher growth rate when compared to companies that don't have the same features.
Thejo Engineering's Earnings Growth And 24% ROE
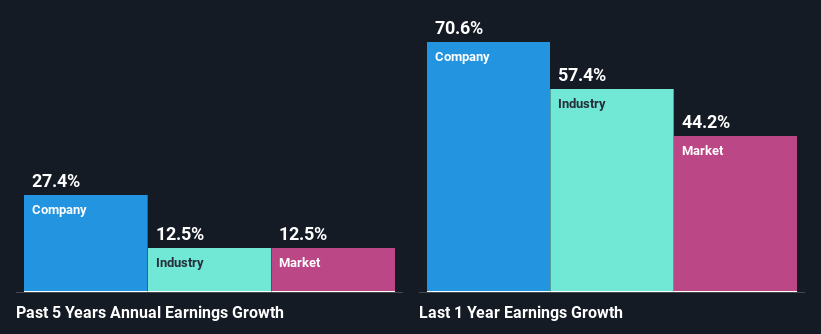
To begin with, Thejo Engineering seems to have a respectable ROE. Especially when compared to the industry average of 13% the company's ROE looks pretty impressive. This certainly adds some context to Thejo Engineering's exceptional 27% net income growth seen over the past five years. However, there could also be other causes behind this growth. For instance, the company has a low payout ratio or is being managed efficiently.
As a next step, we compared Thejo Engineering's net income growth with the industry, and pleasingly, we found that the growth seen by the company is higher than the average industry growth of 12%.
The basis for attaching value to a company is, to a great extent, tied to its earnings growth. It’s important for an investor to know whether the market has priced in the company's expected earnings growth (or decline). By doing so, they will have an idea if the stock is headed into clear blue waters or if swampy waters await. If you're wondering about Thejo Engineering's's valuation, check out this gauge of its price-to-earnings ratio, as compared to its industry.
Is Thejo Engineering Making Efficient Use Of Its Profits?
Thejo Engineering's ' three-year median payout ratio is on the lower side at 7.4% implying that it is retaining a higher percentage (93%) of its profits. So it looks like Thejo Engineering is reinvesting profits heavily to grow its business, which shows in its earnings growth.
Moreover, Thejo Engineering is determined to keep sharing its profits with shareholders which we infer from its long history of four years of paying a dividend.
Summary
On the whole, we feel that Thejo Engineering's performance has been quite good. Particularly, we like that the company is reinvesting heavily into its business, and at a high rate of return. Unsurprisingly, this has led to an impressive earnings growth. If the company continues to grow its earnings the way it has, that could have a positive impact on its share price given how earnings per share influence long-term share prices. Not to forget, share price outcomes are also dependent on the potential risks a company may face. So it is important for investors to be aware of the risks involved in the business. You can see the 1 risk we have identified for Thejo Engineering by visiting our risks dashboard for free on our platform here.
Valuation is complex, but we're here to simplify it.
Discover if Thejo Engineering might be undervalued or overvalued with our detailed analysis, featuring fair value estimates, potential risks, dividends, insider trades, and its financial condition.
Access Free AnalysisHave feedback on this article? Concerned about the content? Get in touch with us directly. Alternatively, email editorial-team (at) simplywallst.com.
This article by Simply Wall St is general in nature. We provide commentary based on historical data and analyst forecasts only using an unbiased methodology and our articles are not intended to be financial advice. It does not constitute a recommendation to buy or sell any stock, and does not take account of your objectives, or your financial situation. We aim to bring you long-term focused analysis driven by fundamental data. Note that our analysis may not factor in the latest price-sensitive company announcements or qualitative material. Simply Wall St has no position in any stocks mentioned.
About NSEI:THEJO
Thejo Engineering
Designs, develops, manufactures, and supplies rubber and polyurethane based engineering products for bulk material handling systems, mineral processing, and corrosion protection applications in India and internationally.
Flawless balance sheet with questionable track record.
Market Insights

Advertisement
Community Narratives
100% Patient Improvement in trial puts this $16M Biotech on the radar
Fair Value US$5.30|65.7% undervalued
JO
Community Contributor
Exxon Mobil's 17.5% Upside Promises Industry-Leading Returns in Energy Transition
Fair Value US$132.00|14.9% undervalued
HE
Community Contributor
NHC Analysis: Quality at a Good Price. A Golden Opportunity?
Fair Value US$179.80|35.4% undervalued
DA
Community Contributor
Product Refresh And Global Expansion Will Empower Future Market Leadership
Fair Value US$202.60|21.0% undervalued
AN
Based on Analyst Price Targets