Does Technofab Engineering Limited’s (NSE:TECHNOFAB) ROCE Reflect Well On The Business?


Today we are going to look at Technofab Engineering Limited (NSE:TECHNOFAB) to see whether it might be an attractive investment prospect. Specifically, we'll consider its Return On Capital Employed (ROCE), since that will give us an insight into how efficiently the business can generate profits from the capital it requires.
Firstly, we'll go over how we calculate ROCE. Then we'll compare its ROCE to similar companies. Last but not least, we'll look at what impact its current liabilities have on its ROCE.
Return On Capital Employed (ROCE): What is it?
ROCE measures the 'return' (pre-tax profit) a company generates from capital employed in its business. In general, businesses with a higher ROCE are usually better quality. In brief, it is a useful tool, but it is not without drawbacks. Renowned investment researcher Michael Mauboussin has suggested that a high ROCE can indicate that 'one dollar invested in the company generates value of more than one dollar'.
How Do You Calculate Return On Capital Employed?
Analysts use this formula to calculate return on capital employed:
Return on Capital Employed = Earnings Before Interest and Tax (EBIT) ÷ (Total Assets - Current Liabilities)
Or for Technofab Engineering:
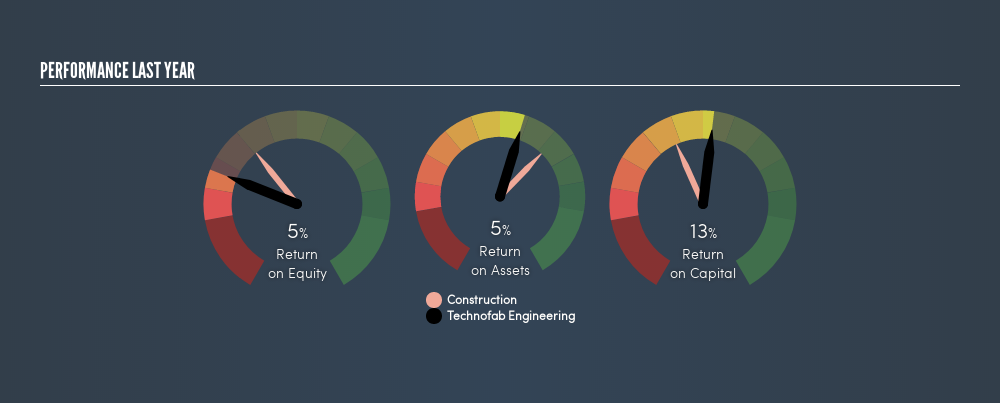
0.13 = ₹494m ÷ (₹7.0b - ₹3.1b) (Based on the trailing twelve months to March 2018.)
So, Technofab Engineering has an ROCE of 13%.
See our latest analysis for Technofab Engineering
Is Technofab Engineering's ROCE Good?
ROCE can be useful when making comparisons, such as between similar companies. We can see Technofab Engineering's ROCE is around the 13% average reported by the Construction industry. Setting aside the industry comparison for now, Technofab Engineering's ROCE is mediocre in absolute terms, considering the risk of investing in stocks versus the safety of a bank account. Readers may find more attractive investment prospects elsewhere.
As we can see, Technofab Engineering currently has an ROCE of 13% compared to its ROCE 3 years ago, which was 9.1%. This makes us think about whether the company has been reinvesting shrewdly.
Remember that this metric is backwards looking - it shows what has happened in the past, and does not accurately predict the future. Companies in cyclical industries can be difficult to understand using ROCE, as returns typically look high during boom times, and low during busts. ROCE is only a point-in-time measure. If Technofab Engineering is cyclical, it could make sense to check out this freegraph of past earnings, revenue and cash flow.
What Are Current Liabilities, And How Do They Affect Technofab Engineering's ROCE?
Current liabilities include invoices, such as supplier payments, short-term debt, or a tax bill, that need to be paid within 12 months. Due to the way ROCE is calculated, a high level of current liabilities makes a company look as though it has less capital employed, and thus can (sometimes unfairly) boost the ROCE. To check the impact of this, we calculate if a company has high current liabilities relative to its total assets.
Technofab Engineering has total assets of ₹7.0b and current liabilities of ₹3.1b. Therefore its current liabilities are equivalent to approximately 45% of its total assets. Technofab Engineering's ROCE is improved somewhat by its moderate amount of current liabilities.
What We Can Learn From Technofab Engineering's ROCE
Despite this, its ROCE is still mediocre, and you may find more appealing investments elsewhere. But note: Technofab Engineering may not be the best stock to buy. So take a peek at this freelist of interesting companies with strong recent earnings growth (and a P/E ratio below 20).
If you like to buy stocks alongside management, then you might just love this freelist of companies. (Hint: insiders have been buying them).
We aim to bring you long-term focused research analysis driven by fundamental data. Note that our analysis may not factor in the latest price-sensitive company announcements or qualitative material.
If you spot an error that warrants correction, please contact the editor at editorial-team@simplywallst.com. This article by Simply Wall St is general in nature. It does not constitute a recommendation to buy or sell any stock, and does not take account of your objectives, or your financial situation. Simply Wall St has no position in the stocks mentioned. Thank you for reading.
Market Insights

Community Narratives

