
Advertisement
Insiders were the biggest winners as Stylam Industries Limited's (NSE:STYLAMIND) market cap grew by ₹3.5b last week
Key Insights
- Insiders appear to have a vested interest in Stylam Industries' growth, as seen by their sizeable ownership
- The top 3 shareholders own 50% of the company
- Institutional ownership in Stylam Industries is 16%
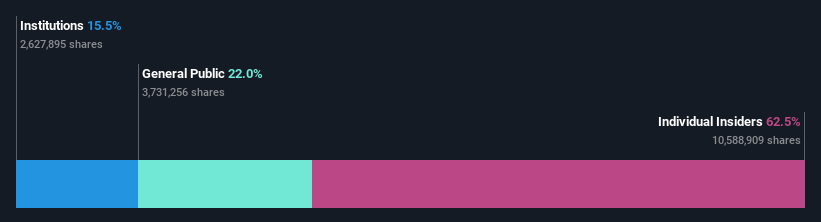
A look at the shareholders of Stylam Industries Limited (NSE:STYLAMIND) can tell us which group is most powerful. With 62% stake, individual insiders possess the maximum shares in the company. That is, the group stands to benefit the most if the stock rises (or lose the most if there is a downturn).
Clearly, insiders benefitted the most after the company's market cap rose by ₹3.5b last week.
In the chart below, we zoom in on the different ownership groups of Stylam Industries.
Check out our latest analysis for Stylam Industries
What Does The Institutional Ownership Tell Us About Stylam Industries?
Institutions typically measure themselves against a benchmark when reporting to their own investors, so they often become more enthusiastic about a stock once it's included in a major index. We would expect most companies to have some institutions on the register, especially if they are growing.
Stylam Industries already has institutions on the share registry. Indeed, they own a respectable stake in the company. This suggests some credibility amongst professional investors. But we can't rely on that fact alone since institutions make bad investments sometimes, just like everyone does. If multiple institutions change their view on a stock at the same time, you could see the share price drop fast. It's therefore worth looking at Stylam Industries' earnings history below. Of course, the future is what really matters.
Hedge funds don't have many shares in Stylam Industries. Our data shows that Satish Gupta is the largest shareholder with 24% of shares outstanding. Meanwhile, the second and third largest shareholders, hold 21% and 4.9%, of the shares outstanding, respectively. Two of the top three shareholders happen to be Chief Executive Officer and Member of the Board of Directors, respectively. That is, insiders feature higher up in the heirarchy of the company's top shareholders.
A more detailed study of the shareholder registry showed us that 3 of the top shareholders have a considerable amount of ownership in the company, via their 50% stake.
Researching institutional ownership is a good way to gauge and filter a stock's expected performance. The same can be achieved by studying analyst sentiments. There are plenty of analysts covering the stock, so it might be worth seeing what they are forecasting, too.
Insider Ownership Of Stylam Industries
The definition of an insider can differ slightly between different countries, but members of the board of directors always count. Management ultimately answers to the board. However, it is not uncommon for managers to be executive board members, especially if they are a founder or the CEO.
Insider ownership is positive when it signals leadership are thinking like the true owners of the company. However, high insider ownership can also give immense power to a small group within the company. This can be negative in some circumstances.
It seems that insiders own more than half the Stylam Industries Limited stock. This gives them a lot of power. Given it has a market cap of ₹37b, that means they have ₹23b worth of shares. Most would argue this is a positive, showing strong alignment with shareholders. You can click here to see if those insiders have been buying or selling.
General Public Ownership
With a 22% ownership, the general public, mostly comprising of individual investors, have some degree of sway over Stylam Industries. While this group can't necessarily call the shots, it can certainly have a real influence on how the company is run.
Next Steps:
While it is well worth considering the different groups that own a company, there are other factors that are even more important.
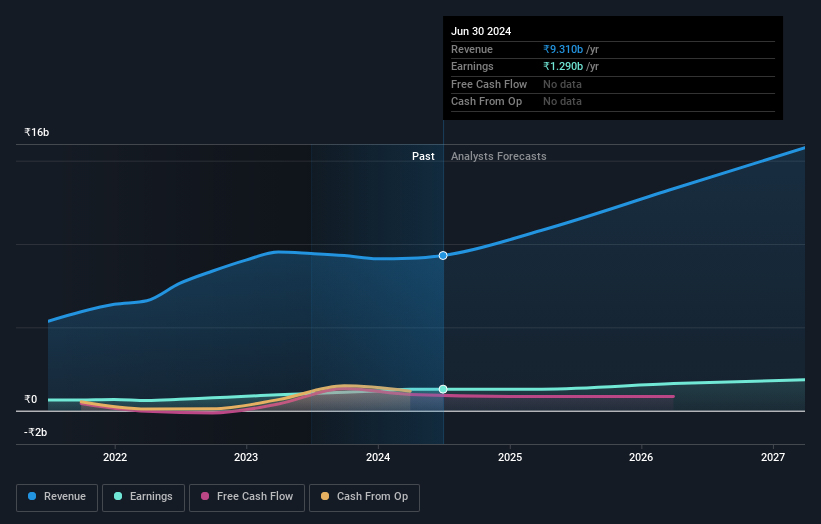
Many find it useful to take an in depth look at how a company has performed in the past. You can access this detailed graph of past earnings, revenue and cash flow.
If you would prefer discover what analysts are predicting in terms of future growth, do not miss this free report on analyst forecasts.
NB: Figures in this article are calculated using data from the last twelve months, which refer to the 12-month period ending on the last date of the month the financial statement is dated. This may not be consistent with full year annual report figures.
New: Manage All Your Stock Portfolios in One Place
We've created the ultimate portfolio companion for stock investors, and it's free.
• Connect an unlimited number of Portfolios and see your total in one currency
• Be alerted to new Warning Signs or Risks via email or mobile
• Track the Fair Value of your stocks
Have feedback on this article? Concerned about the content? Get in touch with us directly. Alternatively, email editorial-team (at) simplywallst.com.
This article by Simply Wall St is general in nature. We provide commentary based on historical data and analyst forecasts only using an unbiased methodology and our articles are not intended to be financial advice. It does not constitute a recommendation to buy or sell any stock, and does not take account of your objectives, or your financial situation. We aim to bring you long-term focused analysis driven by fundamental data. Note that our analysis may not factor in the latest price-sensitive company announcements or qualitative material. Simply Wall St has no position in any stocks mentioned.
About NSEI:STYLAMIND
Stylam Industries
Manufactures and sells laminates and allied products under the STYLAM brand name in India.
Flawless balance sheet and fair value.
Similar Companies
Market Insights

Advertisement
Community Narratives
Kodiak AI - a potential 100 bagger opportunity?
Fair Value US$14.00|40.6% undervalued
DA
Community Contributor
A Fair Price for a Great Business Facing Real Threats
Fair Value US$383.06|10.4% undervalued
IM
Community Contributor
AXON And Shopify Integration Will Unlock Global Mobile Advertising
Fair Value US$646.30|12.4% undervalued
AN
Based on Analyst Price Targets