
Advertisement
- India
- /
- Electrical
- /
- NSEI:SPECTRUM
Spectrum Electrical Industries Limited's (NSE:SPECTRUM) 31% Price Boost Is Out Of Tune With Revenues
Spectrum Electrical Industries Limited (NSE:SPECTRUM) shares have continued their recent momentum with a 31% gain in the last month alone. This latest share price bounce rounds out a remarkable 827% gain over the last twelve months.
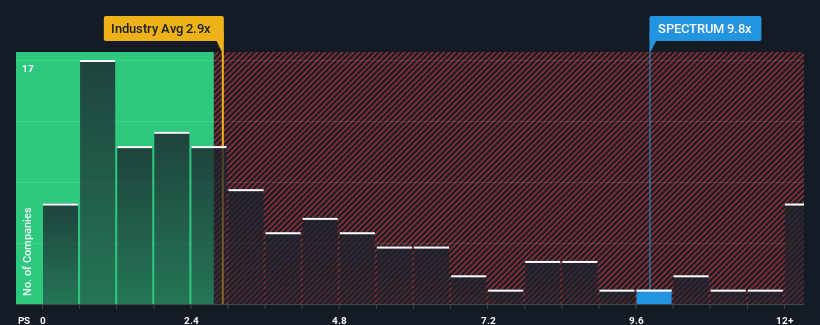
Following the firm bounce in price, you could be forgiven for thinking Spectrum Electrical Industries is a stock to steer clear of with a price-to-sales ratios (or "P/S") of 9.8x, considering almost half the companies in India's Electrical industry have P/S ratios below 2.9x. Nonetheless, we'd need to dig a little deeper to determine if there is a rational basis for the highly elevated P/S.
Check out our latest analysis for Spectrum Electrical Industries
How Spectrum Electrical Industries Has Been Performing
Revenue has risen at a steady rate over the last year for Spectrum Electrical Industries, which is generally not a bad outcome. One possibility is that the P/S ratio is high because investors think this good revenue growth will be enough to outperform the broader industry in the near future. If not, then existing shareholders may be a little nervous about the viability of the share price.
Want the full picture on earnings, revenue and cash flow for the company? Then our free report on Spectrum Electrical Industries will help you shine a light on its historical performance.Do Revenue Forecasts Match The High P/S Ratio?
There's an inherent assumption that a company should far outperform the industry for P/S ratios like Spectrum Electrical Industries' to be considered reasonable.
If we review the last year of revenue growth, the company posted a worthy increase of 2.6%. This was backed up an excellent period prior to see revenue up by 113% in total over the last three years. So we can start by confirming that the company has done a great job of growing revenues over that time.
Weighing that recent medium-term revenue trajectory against the broader industry's one-year forecast for expansion of 32% shows it's about the same on an annualised basis.
With this information, we find it interesting that Spectrum Electrical Industries is trading at a high P/S compared to the industry. It seems most investors are ignoring the fairly average recent growth rates and are willing to pay up for exposure to the stock. Nevertheless, they may be setting themselves up for future disappointment if the P/S falls to levels more in line with recent growth rates.
What We Can Learn From Spectrum Electrical Industries' P/S?
Shares in Spectrum Electrical Industries have seen a strong upwards swing lately, which has really helped boost its P/S figure. Typically, we'd caution against reading too much into price-to-sales ratios when settling on investment decisions, though it can reveal plenty about what other market participants think about the company.
Our look into Spectrum Electrical Industries has shown that it currently trades on a higher than expected P/S since its recent three-year growth is only in line with the wider industry forecast. Right now we are uncomfortable with the high P/S as this revenue performance isn't likely to support such positive sentiment for long. If recent medium-term revenue trends continue, it will place shareholders' investments at risk and potential investors in danger of paying an unnecessary premium.
It is also worth noting that we have found 2 warning signs for Spectrum Electrical Industries that you need to take into consideration.
If these risks are making you reconsider your opinion on Spectrum Electrical Industries, explore our interactive list of high quality stocks to get an idea of what else is out there.
New: Manage All Your Stock Portfolios in One Place
We've created the ultimate portfolio companion for stock investors, and it's free.
• Connect an unlimited number of Portfolios and see your total in one currency
• Be alerted to new Warning Signs or Risks via email or mobile
• Track the Fair Value of your stocks
Have feedback on this article? Concerned about the content? Get in touch with us directly. Alternatively, email editorial-team (at) simplywallst.com.
This article by Simply Wall St is general in nature. We provide commentary based on historical data and analyst forecasts only using an unbiased methodology and our articles are not intended to be financial advice. It does not constitute a recommendation to buy or sell any stock, and does not take account of your objectives, or your financial situation. We aim to bring you long-term focused analysis driven by fundamental data. Note that our analysis may not factor in the latest price-sensitive company announcements or qualitative material. Simply Wall St has no position in any stocks mentioned.
About NSEI:SPECTRUM
Spectrum Electrical Industries
Designs, manufactures, and sells electrical, automobile, and irrigation components in India.
Solid track record with mediocre balance sheet.
Market Insights

Advertisement
Community Narratives
Kodiak AI - a potential 100 bagger opportunity?
Fair Value US$14.00|44.7% undervalued
DA
Community Contributor
A Fair Price for a Great Business Facing Real Threats
Fair Value US$383.06|13.0% undervalued
IM
Community Contributor
AXON And Shopify Integration Will Unlock Global Mobile Advertising
Fair Value US$646.30|0% overvalued
AN
Based on Analyst Price Targets