

Howard Marks put it nicely when he said that, rather than worrying about share price volatility, 'The possibility of permanent loss is the risk I worry about... and every practical investor I know worries about.' So it might be obvious that you need to consider debt, when you think about how risky any given stock is, because too much debt can sink a company. We can see that Skipper Limited (NSE:SKIPPER) does use debt in its business. But the more important question is: how much risk is that debt creating?
What Risk Does Debt Bring?
Debt and other liabilities become risky for a business when it cannot easily fulfill those obligations, either with free cash flow or by raising capital at an attractive price. Part and parcel of capitalism is the process of 'creative destruction' where failed businesses are mercilessly liquidated by their bankers. However, a more frequent (but still costly) occurrence is where a company must issue shares at bargain-basement prices, permanently diluting shareholders, just to shore up its balance sheet. Having said that, the most common situation is where a company manages its debt reasonably well - and to its own advantage. The first thing to do when considering how much debt a business uses is to look at its cash and debt together.
Check out our latest analysis for Skipper
What Is Skipper's Net Debt?
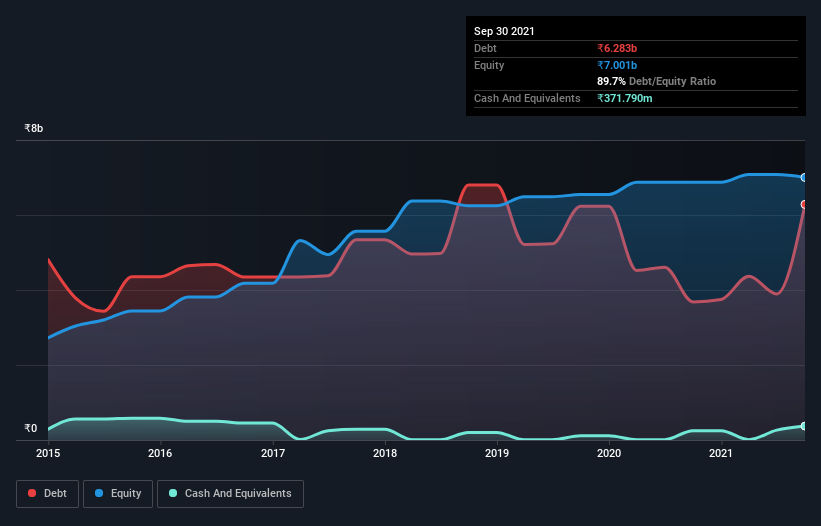
You can click the graphic below for the historical numbers, but it shows that as of September 2021 Skipper had ₹6.28b of debt, an increase on ₹3.68b, over one year. However, it also had ₹371.8m in cash, and so its net debt is ₹5.91b.
How Healthy Is Skipper's Balance Sheet?
We can see from the most recent balance sheet that Skipper had liabilities of ₹11.2b falling due within a year, and liabilities of ₹2.54b due beyond that. Offsetting this, it had ₹371.8m in cash and ₹4.74b in receivables that were due within 12 months. So it has liabilities totalling ₹8.67b more than its cash and near-term receivables, combined.
When you consider that this deficiency exceeds the company's ₹7.94b market capitalization, you might well be inclined to review the balance sheet intently. In the scenario where the company had to clean up its balance sheet quickly, it seems likely shareholders would suffer extensive dilution.
In order to size up a company's debt relative to its earnings, we calculate its net debt divided by its earnings before interest, tax, depreciation, and amortization (EBITDA) and its earnings before interest and tax (EBIT) divided by its interest expense (its interest cover). The advantage of this approach is that we take into account both the absolute quantum of debt (with net debt to EBITDA) and the actual interest expenses associated with that debt (with its interest cover ratio).
While we wouldn't worry about Skipper's net debt to EBITDA ratio of 4.4, we think its super-low interest cover of 1.3 times is a sign of high leverage. It seems clear that the cost of borrowing money is negatively impacting returns for shareholders, of late. On a slightly more positive note, Skipper grew its EBIT at 13% over the last year, further increasing its ability to manage debt. The balance sheet is clearly the area to focus on when you are analysing debt. But you can't view debt in total isolation; since Skipper will need earnings to service that debt. So if you're keen to discover more about its earnings, it might be worth checking out this graph of its long term earnings trend.
But our final consideration is also important, because a company cannot pay debt with paper profits; it needs cold hard cash. So the logical step is to look at the proportion of that EBIT that is matched by actual free cash flow. Happily for any shareholders, Skipper actually produced more free cash flow than EBIT over the last three years. That sort of strong cash conversion gets us as excited as the crowd when the beat drops at a Daft Punk concert.
Our View
Neither Skipper's ability to cover its interest expense with its EBIT nor its net debt to EBITDA gave us confidence in its ability to take on more debt. But its conversion of EBIT to free cash flow tells a very different story, and suggests some resilience. When we consider all the factors discussed, it seems to us that Skipper is taking some risks with its use of debt. While that debt can boost returns, we think the company has enough leverage now. The balance sheet is clearly the area to focus on when you are analysing debt. But ultimately, every company can contain risks that exist outside of the balance sheet. To that end, you should learn about the 3 warning signs we've spotted with Skipper (including 2 which are concerning) .
If, after all that, you're more interested in a fast growing company with a rock-solid balance sheet, then check out our list of net cash growth stocks without delay.
New: Manage All Your Stock Portfolios in One Place
We've created the ultimate portfolio companion for stock investors, and it's free.
• Connect an unlimited number of Portfolios and see your total in one currency
• Be alerted to new Warning Signs or Risks via email or mobile
• Track the Fair Value of your stocks
Have feedback on this article? Concerned about the content? Get in touch with us directly. Alternatively, email editorial-team (at) simplywallst.com.
This article by Simply Wall St is general in nature. We provide commentary based on historical data and analyst forecasts only using an unbiased methodology and our articles are not intended to be financial advice. It does not constitute a recommendation to buy or sell any stock, and does not take account of your objectives, or your financial situation. We aim to bring you long-term focused analysis driven by fundamental data. Note that our analysis may not factor in the latest price-sensitive company announcements or qualitative material. Simply Wall St has no position in any stocks mentioned.
About NSEI:SKIPPER
Skipper
Manufactures and sells transmission and distribution structures, telecom towers, and fasteners in India.
Reasonable growth potential with proven track record.

