- India
- /
- Construction
- /
- NSEI:SEPC
Can Shriram EPC (NSE:SHRIRAMEPC) Continue To Grow Its Returns On Capital?


If you're not sure where to start when looking for the next multi-bagger, there are a few key trends you should keep an eye out for. Amongst other things, we'll want to see two things; firstly, a growing return on capital employed (ROCE) and secondly, an expansion in the company's amount of capital employed. Basically this means that a company has profitable initiatives that it can continue to reinvest in, which is a trait of a compounding machine. Speaking of which, we noticed some great changes in Shriram EPC's (NSE:SHRIRAMEPC) returns on capital, so let's have a look.
Understanding Return On Capital Employed (ROCE)
For those who don't know, ROCE is a measure of a company's yearly pre-tax profit (its return), relative to the capital employed in the business. To calculate this metric for Shriram EPC, this is the formula:
Return on Capital Employed = Earnings Before Interest and Tax (EBIT) ÷ (Total Assets - Current Liabilities)
0.00041 = ₹6.4m ÷ (₹25b - ₹9.2b) (Based on the trailing twelve months to September 2020).
Therefore, Shriram EPC has an ROCE of 0.04%. In absolute terms, that's a low return and it also under-performs the Construction industry average of 9.1%.
See our latest analysis for Shriram EPC
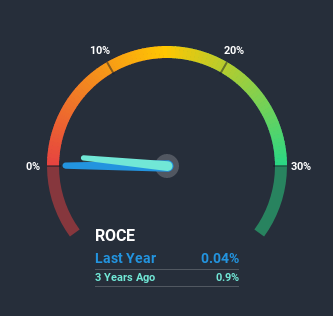
Historical performance is a great place to start when researching a stock so above you can see the gauge for Shriram EPC's ROCE against it's prior returns. If you're interested in investigating Shriram EPC's past further, check out this free graph of past earnings, revenue and cash flow.
So How Is Shriram EPC's ROCE Trending?
We're delighted to see that Shriram EPC is reaping rewards from its investments and has now broken into profitability. While the business is profitable now, it used to be incurring losses on invested capital five years ago. In regards to capital employed, Shriram EPC is using 25% less capital than it was five years ago, which on the surface, can indicate that the business has become more efficient at generating these returns. The reduction could indicate that the company is selling some assets, and considering returns are up, they appear to be selling the right ones.
On a side note, we noticed that the improvement in ROCE appears to be partly fueled by an increase in current liabilities. Essentially the business now has suppliers or short-term creditors funding about 37% of its operations, which isn't ideal. Keep an eye out for future increases because when the ratio of current liabilities to total assets gets particularly high, this can introduce some new risks for the business.In Conclusion...
In a nutshell, we're pleased to see that Shriram EPC has been able to generate higher returns from less capital. And since the stock has dived 88% over the last five years, there may be other factors affecting the company's prospects. Still, it's worth doing some further research to see if the trends will continue into the future.
Like most companies, Shriram EPC does come with some risks, and we've found 1 warning sign that you should be aware of.
While Shriram EPC may not currently earn the highest returns, we've compiled a list of companies that currently earn more than 25% return on equity. Check out this free list here.
When trading Shriram EPC or any other investment, use the platform considered by many to be the Professional's Gateway to the Worlds Market, Interactive Brokers. You get the lowest-cost* trading on stocks, options, futures, forex, bonds and funds worldwide from a single integrated account. Promoted
If you're looking to trade SEPC, open an account with the lowest-cost platform trusted by professionals, Interactive Brokers.
With clients in over 200 countries and territories, and access to 160 markets, IBKR lets you trade stocks, options, futures, forex, bonds and funds from a single integrated account.
Enjoy no hidden fees, no account minimums, and FX conversion rates as low as 0.03%, far better than what most brokers offer.
Sponsored ContentNew: Manage All Your Stock Portfolios in One Place
We've created the ultimate portfolio companion for stock investors, and it's free.
• Connect an unlimited number of Portfolios and see your total in one currency
• Be alerted to new Warning Signs or Risks via email or mobile
• Track the Fair Value of your stocks
This article by Simply Wall St is general in nature. It does not constitute a recommendation to buy or sell any stock, and does not take account of your objectives, or your financial situation. We aim to bring you long-term focused analysis driven by fundamental data. Note that our analysis may not factor in the latest price-sensitive company announcements or qualitative material. Simply Wall St has no position in any stocks mentioned.
*Interactive Brokers Rated Lowest Cost Broker by StockBrokers.com Annual Online Review 2020
Have feedback on this article? Concerned about the content? Get in touch with us directly. Alternatively, email editorial-team@simplywallst.com.
About NSEI:SEPC
SEPC
Provides integrated design, engineering, procurement, construction, and project management services in India and internationally.
Adequate balance sheet with acceptable track record.
Similar Companies
Market Insights

Community Narratives

