- India
- /
- Construction
- /
- NSEI:SALASAR
Salasar Techno Engineering's (NSE:SALASAR) Returns On Capital Not Reflecting Well On The Business
If we want to find a potential multi-bagger, often there are underlying trends that can provide clues. Amongst other things, we'll want to see two things; firstly, a growing return on capital employed (ROCE) and secondly, an expansion in the company's amount of capital employed. Basically this means that a company has profitable initiatives that it can continue to reinvest in, which is a trait of a compounding machine. Having said that, from a first glance at Salasar Techno Engineering (NSE:SALASAR) we aren't jumping out of our chairs at how returns are trending, but let's have a deeper look.
What Is Return On Capital Employed (ROCE)?
Just to clarify if you're unsure, ROCE is a metric for evaluating how much pre-tax income (in percentage terms) a company earns on the capital invested in its business. To calculate this metric for Salasar Techno Engineering, this is the formula:
Return on Capital Employed = Earnings Before Interest and Tax (EBIT) ÷ (Total Assets - Current Liabilities)
0.15 = ₹1.2b ÷ (₹14b - ₹6.9b) (Based on the trailing twelve months to September 2024).
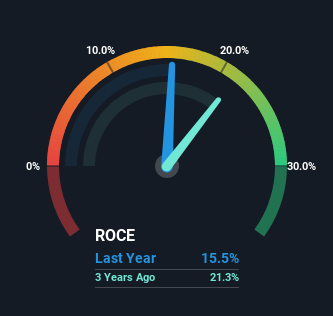
Thus, Salasar Techno Engineering has an ROCE of 15%. That's a pretty standard return and it's in line with the industry average of 15%.
Check out our latest analysis for Salasar Techno Engineering

Historical performance is a great place to start when researching a stock so above you can see the gauge for Salasar Techno Engineering's ROCE against it's prior returns. If you're interested in investigating Salasar Techno Engineering's past further, check out this free graph covering Salasar Techno Engineering's past earnings, revenue and cash flow.
What Can We Tell From Salasar Techno Engineering's ROCE Trend?
We weren't thrilled with the trend because Salasar Techno Engineering's ROCE has reduced by 49% over the last five years, while the business employed 236% more capital. That being said, Salasar Techno Engineering raised some capital prior to their latest results being released, so that could partly explain the increase in capital employed. It's unlikely that all of the funds raised have been put to work yet, so as a consequence Salasar Techno Engineering might not have received a full period of earnings contribution from it.
On a side note, Salasar Techno Engineering's current liabilities are still rather high at 48% of total assets. This can bring about some risks because the company is basically operating with a rather large reliance on its suppliers or other sorts of short-term creditors. Ideally we'd like to see this reduce as that would mean fewer obligations bearing risks.
The Key Takeaway
Even though returns on capital have fallen in the short term, we find it promising that revenue and capital employed have both increased for Salasar Techno Engineering. And the stock has done incredibly well with a 1,356% return over the last five years, so long term investors are no doubt ecstatic with that result. So while investors seem to be recognizing these promising trends, we would look further into this stock to make sure the other metrics justify the positive view.
If you'd like to know more about Salasar Techno Engineering, we've spotted 4 warning signs, and 1 of them is significant.
For those who like to invest in solid companies, check out this free list of companies with solid balance sheets and high returns on equity.
New: Manage All Your Stock Portfolios in One Place
We've created the ultimate portfolio companion for stock investors, and it's free.
• Connect an unlimited number of Portfolios and see your total in one currency
• Be alerted to new Warning Signs or Risks via email or mobile
• Track the Fair Value of your stocks
Have feedback on this article? Concerned about the content? Get in touch with us directly. Alternatively, email editorial-team (at) simplywallst.com.
This article by Simply Wall St is general in nature. We provide commentary based on historical data and analyst forecasts only using an unbiased methodology and our articles are not intended to be financial advice. It does not constitute a recommendation to buy or sell any stock, and does not take account of your objectives, or your financial situation. We aim to bring you long-term focused analysis driven by fundamental data. Note that our analysis may not factor in the latest price-sensitive company announcements or qualitative material. Simply Wall St has no position in any stocks mentioned.
About NSEI:SALASAR
Salasar Techno Engineering
Engages in the manufacture and sale of galvanized and non-galvanized steel structures in India and internationally.
Adequate balance sheet with questionable track record.
Similar Companies
Market Insights
Community Narratives


