
Advertisement
- India
- /
- Electrical
- /
- NSEI:SAAKSHI
Saakshi Medtech and Panels (NSE:SAAKSHI) Might Be Having Difficulty Using Its Capital Effectively
What trends should we look for it we want to identify stocks that can multiply in value over the long term? In a perfect world, we'd like to see a company investing more capital into its business and ideally the returns earned from that capital are also increasing. If you see this, it typically means it's a company with a great business model and plenty of profitable reinvestment opportunities. Although, when we looked at Saakshi Medtech and Panels (NSE:SAAKSHI), it didn't seem to tick all of these boxes.
Return On Capital Employed (ROCE): What Is It?
For those who don't know, ROCE is a measure of a company's yearly pre-tax profit (its return), relative to the capital employed in the business. Analysts use this formula to calculate it for Saakshi Medtech and Panels:
Return on Capital Employed = Earnings Before Interest and Tax (EBIT) ÷ (Total Assets - Current Liabilities)
0.057 = ₹64m ÷ (₹1.3b - ₹186m) (Based on the trailing twelve months to March 2025).
Thus, Saakshi Medtech and Panels has an ROCE of 5.7%. In absolute terms, that's a low return and it also under-performs the Electrical industry average of 19%.
View our latest analysis for Saakshi Medtech and Panels
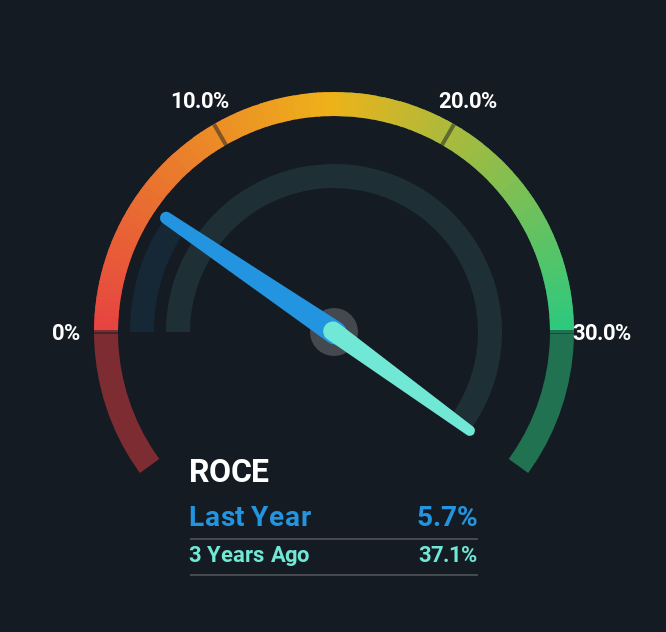
While the past is not representative of the future, it can be helpful to know how a company has performed historically, which is why we have this chart above. If you're interested in investigating Saakshi Medtech and Panels' past further, check out this free graph covering Saakshi Medtech and Panels' past earnings, revenue and cash flow.
What Can We Tell From Saakshi Medtech and Panels' ROCE Trend?
When we looked at the ROCE trend at Saakshi Medtech and Panels, we didn't gain much confidence. Around five years ago the returns on capital were 37%, but since then they've fallen to 5.7%. And considering revenue has dropped while employing more capital, we'd be cautious. This could mean that the business is losing its competitive advantage or market share, because while more money is being put into ventures, it's actually producing a lower return - "less bang for their buck" per se.
On a related note, Saakshi Medtech and Panels has decreased its current liabilities to 14% of total assets. So we could link some of this to the decrease in ROCE. Effectively this means their suppliers or short-term creditors are funding less of the business, which reduces some elements of risk. Since the business is basically funding more of its operations with it's own money, you could argue this has made the business less efficient at generating ROCE.
Our Take On Saakshi Medtech and Panels' ROCE
From the above analysis, we find it rather worrisome that returns on capital and sales for Saakshi Medtech and Panels have fallen, meanwhile the business is employing more capital than it was five years ago. It should come as no surprise then that the stock has fallen 23% over the last year, so it looks like investors are recognizing these changes. With underlying trends that aren't great in these areas, we'd consider looking elsewhere.
If you'd like to know about the risks facing Saakshi Medtech and Panels, we've discovered 3 warning signs that you should be aware of.
If you want to search for solid companies with great earnings, check out this free list of companies with good balance sheets and impressive returns on equity.
New: Manage All Your Stock Portfolios in One Place
We've created the ultimate portfolio companion for stock investors, and it's free.
• Connect an unlimited number of Portfolios and see your total in one currency
• Be alerted to new Warning Signs or Risks via email or mobile
• Track the Fair Value of your stocks
Have feedback on this article? Concerned about the content? Get in touch with us directly. Alternatively, email editorial-team (at) simplywallst.com.
This article by Simply Wall St is general in nature. We provide commentary based on historical data and analyst forecasts only using an unbiased methodology and our articles are not intended to be financial advice. It does not constitute a recommendation to buy or sell any stock, and does not take account of your objectives, or your financial situation. We aim to bring you long-term focused analysis driven by fundamental data. Note that our analysis may not factor in the latest price-sensitive company announcements or qualitative material. Simply Wall St has no position in any stocks mentioned.
About NSEI:SAAKSHI
Saakshi Medtech and Panels
Engages in the manufacture and sale of electrical control panels and cabinets in India.
Excellent balance sheet with low risk.
Similar Companies
Market Insights

Advertisement
Community Narratives
Quality at a Premium. A time to watch, not to buy?
Fair Value US$154.56|27.6% undervalued
DA
Community Contributor
GRAB: The Super-App at the Heart of Southeast Asia’s Digital Boom
Fair Value US$8.20|22.1% undervalued
BL
Community Contributor
Verve Group to Surge with 51.61% Revenue Growth
Fair Value €6.00|60.0% undervalued
ME
Community Contributor