- India
- /
- Trade Distributors
- /
- NSEI:MSTCLTD
Are Strong Financial Prospects The Force That Is Driving The Momentum In MSTC Limited's NSE:MSTCLTD) Stock?

MSTC's (NSE:MSTCLTD) stock is up by a considerable 56% over the past three months. Given the company's impressive performance, we decided to study its financial indicators more closely as a company's financial health over the long-term usually dictates market outcomes. Specifically, we decided to study MSTC's ROE in this article.
Return on Equity or ROE is a test of how effectively a company is growing its value and managing investors’ money. In other words, it is a profitability ratio which measures the rate of return on the capital provided by the company's shareholders.
View our latest analysis for MSTC
How Do You Calculate Return On Equity?
The formula for return on equity is:
Return on Equity = Net Profit (from continuing operations) ÷ Shareholders' Equity
So, based on the above formula, the ROE for MSTC is:
26% = ₹2.3b ÷ ₹8.9b (Based on the trailing twelve months to December 2023).
The 'return' is the yearly profit. So, this means that for every ₹1 of its shareholder's investments, the company generates a profit of ₹0.26.
Why Is ROE Important For Earnings Growth?
We have already established that ROE serves as an efficient profit-generating gauge for a company's future earnings. We now need to evaluate how much profit the company reinvests or "retains" for future growth which then gives us an idea about the growth potential of the company. Assuming everything else remains unchanged, the higher the ROE and profit retention, the higher the growth rate of a company compared to companies that don't necessarily bear these characteristics.
MSTC's Earnings Growth And 26% ROE
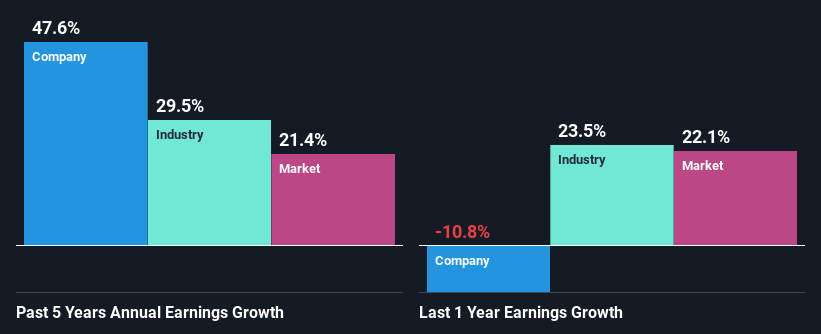
To start with, MSTC's ROE looks acceptable. Especially when compared to the industry average of 7.5% the company's ROE looks pretty impressive. Probably as a result of this, MSTC was able to see an impressive net income growth of 48% over the last five years. We reckon that there could also be other factors at play here. For instance, the company has a low payout ratio or is being managed efficiently.
Next, on comparing with the industry net income growth, we found that MSTC's growth is quite high when compared to the industry average growth of 29% in the same period, which is great to see.
Earnings growth is a huge factor in stock valuation. What investors need to determine next is if the expected earnings growth, or the lack of it, is already built into the share price. Doing so will help them establish if the stock's future looks promising or ominous. If you're wondering about MSTC's's valuation, check out this gauge of its price-to-earnings ratio, as compared to its industry.
Is MSTC Using Its Retained Earnings Effectively?
MSTC has a three-year median payout ratio of 44% (where it is retaining 56% of its income) which is not too low or not too high. This suggests that its dividend is well covered, and given the high growth we discussed above, it looks like MSTC is reinvesting its earnings efficiently.
Besides, MSTC has been paying dividends over a period of three years. This shows that the company is committed to sharing profits with its shareholders.
Summary
On the whole, we feel that MSTC's performance has been quite good. Specifically, we like that the company is reinvesting a huge chunk of its profits at a high rate of return. This of course has caused the company to see substantial growth in its earnings. If the company continues to grow its earnings the way it has, that could have a positive impact on its share price given how earnings per share influence long-term share prices. Not to forget, share price outcomes are also dependent on the potential risks a company may face. So it is important for investors to be aware of the risks involved in the business. You can see the 2 risks we have identified for MSTC by visiting our risks dashboard for free on our platform here.
The New Payments ETF Is Live on NASDAQ:
Money is moving to real-time rails, and a newly listed ETF now gives investors direct exposure. Fast settlement. Institutional custody. Simple access.
Explore how this launch could reshape portfolios
Sponsored ContentNew: Manage All Your Stock Portfolios in One Place
We've created the ultimate portfolio companion for stock investors, and it's free.
• Connect an unlimited number of Portfolios and see your total in one currency
• Be alerted to new Warning Signs or Risks via email or mobile
• Track the Fair Value of your stocks
Have feedback on this article? Concerned about the content? Get in touch with us directly. Alternatively, email editorial-team (at) simplywallst.com.
This article by Simply Wall St is general in nature. We provide commentary based on historical data and analyst forecasts only using an unbiased methodology and our articles are not intended to be financial advice. It does not constitute a recommendation to buy or sell any stock, and does not take account of your objectives, or your financial situation. We aim to bring you long-term focused analysis driven by fundamental data. Note that our analysis may not factor in the latest price-sensitive company announcements or qualitative material. Simply Wall St has no position in any stocks mentioned.
About NSEI:MSTCLTD
MSTC
Engages in marketing, e-commerce, and scrap recovery and allied job businesses primarily in India.
Flawless balance sheet with solid track record.
Similar Companies
Market Insights

Weekly Picks

Early mover in a fast growing industry. Likely to experience share price volatility as they scale


A case for CA$31.80 (undiluted), aka 8,616% upside from CA$0.37 (an 86 bagger!).


Moderation and Stabilisation: HOLD: Fair Price based on a 4-year Cycle is $12.08
Recently Updated Narratives

Meta’s Bold Bet on AI Pays Off

ADP Stock: Solid Fundamentals, But AI Investments Test Its Margin Resilience

Visa Stock: The Toll Booth at the Center of Global Commerce
Popular Narratives


Crazy Undervalued 42 Baggers Silver Play (Active & Running Mine)


NVDA: Expanding AI Demand Will Drive Major Data Center Investments Through 2026

The AI Infrastructure Giant Grows Into Its Valuation
Trending Discussion


