
Legendary fund manager Li Lu (who Charlie Munger backed) once said, 'The biggest investment risk is not the volatility of prices, but whether you will suffer a permanent loss of capital.' So it might be obvious that you need to consider debt, when you think about how risky any given stock is, because too much debt can sink a company. As with many other companies Maks Energy Solutions India Limited (NSE:MAKS) makes use of debt. But the real question is whether this debt is making the company risky.
When Is Debt Dangerous?
Debt and other liabilities become risky for a business when it cannot easily fulfill those obligations, either with free cash flow or by raising capital at an attractive price. If things get really bad, the lenders can take control of the business. However, a more frequent (but still costly) occurrence is where a company must issue shares at bargain-basement prices, permanently diluting shareholders, just to shore up its balance sheet. Of course, the upside of debt is that it often represents cheap capital, especially when it replaces dilution in a company with the ability to reinvest at high rates of return. The first step when considering a company's debt levels is to consider its cash and debt together.
Check out our latest analysis for Maks Energy Solutions India
How Much Debt Does Maks Energy Solutions India Carry?
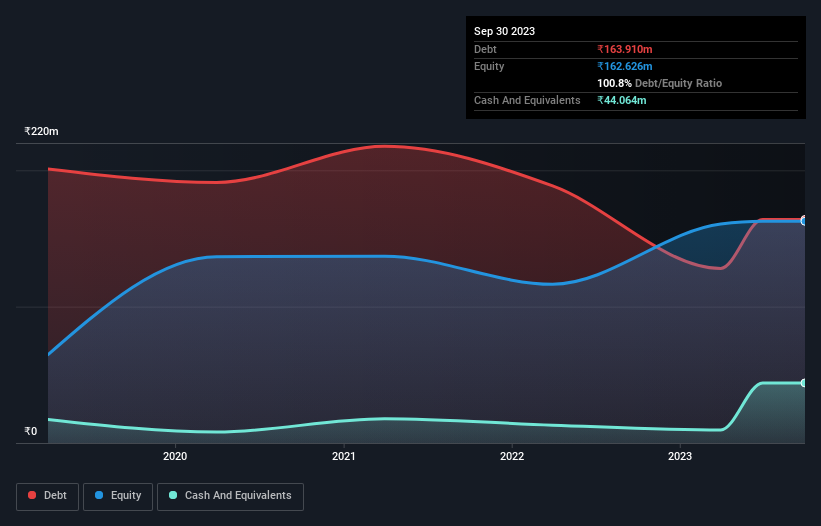
You can click the graphic below for the historical numbers, but it shows that as of September 2023 Maks Energy Solutions India had ₹163.9m of debt, an increase on ₹128.0m, over one year. However, because it has a cash reserve of ₹44.1m, its net debt is less, at about ₹119.8m.
How Strong Is Maks Energy Solutions India's Balance Sheet?
Zooming in on the latest balance sheet data, we can see that Maks Energy Solutions India had liabilities of ₹206.0m due within 12 months and liabilities of ₹11.8m due beyond that. Offsetting these obligations, it had cash of ₹44.1m as well as receivables valued at ₹165.9m due within 12 months. So it has liabilities totalling ₹7.94m more than its cash and near-term receivables, combined.
This state of affairs indicates that Maks Energy Solutions India's balance sheet looks quite solid, as its total liabilities are just about equal to its liquid assets. So while it's hard to imagine that the ₹489.2m company is struggling for cash, we still think it's worth monitoring its balance sheet.
We use two main ratios to inform us about debt levels relative to earnings. The first is net debt divided by earnings before interest, tax, depreciation, and amortization (EBITDA), while the second is how many times its earnings before interest and tax (EBIT) covers its interest expense (or its interest cover, for short). The advantage of this approach is that we take into account both the absolute quantum of debt (with net debt to EBITDA) and the actual interest expenses associated with that debt (with its interest cover ratio).
While we wouldn't worry about Maks Energy Solutions India's net debt to EBITDA ratio of 4.4, we think its super-low interest cover of 1.9 times is a sign of high leverage. It seems clear that the cost of borrowing money is negatively impacting returns for shareholders, of late. More concerning, Maks Energy Solutions India saw its EBIT drop by 6.2% in the last twelve months. If that earnings trend continues the company will face an uphill battle to pay off its debt. There's no doubt that we learn most about debt from the balance sheet. But you can't view debt in total isolation; since Maks Energy Solutions India will need earnings to service that debt. So if you're keen to discover more about its earnings, it might be worth checking out this graph of its long term earnings trend.
Finally, a company can only pay off debt with cold hard cash, not accounting profits. So it's worth checking how much of that EBIT is backed by free cash flow. Over the last three years, Maks Energy Solutions India actually produced more free cash flow than EBIT. That sort of strong cash conversion gets us as excited as the crowd when the beat drops at a Daft Punk concert.
Our View
When it comes to the balance sheet, the standout positive for Maks Energy Solutions India was the fact that it seems able to convert EBIT to free cash flow confidently. But the other factors we noted above weren't so encouraging. To be specific, it seems about as good at covering its interest expense with its EBIT as wet socks are at keeping your feet warm. When we consider all the elements mentioned above, it seems to us that Maks Energy Solutions India is managing its debt quite well. But a word of caution: we think debt levels are high enough to justify ongoing monitoring. The balance sheet is clearly the area to focus on when you are analysing debt. But ultimately, every company can contain risks that exist outside of the balance sheet. We've identified 3 warning signs with Maks Energy Solutions India , and understanding them should be part of your investment process.
At the end of the day, it's often better to focus on companies that are free from net debt. You can access our special list of such companies (all with a track record of profit growth). It's free.
If you're looking to trade Maks Energy Solutions India, open an account with the lowest-cost platform trusted by professionals, Interactive Brokers.
With clients in over 200 countries and territories, and access to 160 markets, IBKR lets you trade stocks, options, futures, forex, bonds and funds from a single integrated account.
Enjoy no hidden fees, no account minimums, and FX conversion rates as low as 0.03%, far better than what most brokers offer.
Sponsored ContentNew: Manage All Your Stock Portfolios in One Place
We've created the ultimate portfolio companion for stock investors, and it's free.
• Connect an unlimited number of Portfolios and see your total in one currency
• Be alerted to new Warning Signs or Risks via email or mobile
• Track the Fair Value of your stocks
Have feedback on this article? Concerned about the content? Get in touch with us directly. Alternatively, email editorial-team (at) simplywallst.com.
This article by Simply Wall St is general in nature. We provide commentary based on historical data and analyst forecasts only using an unbiased methodology and our articles are not intended to be financial advice. It does not constitute a recommendation to buy or sell any stock, and does not take account of your objectives, or your financial situation. We aim to bring you long-term focused analysis driven by fundamental data. Note that our analysis may not factor in the latest price-sensitive company announcements or qualitative material. Simply Wall St has no position in any stocks mentioned.
About NSEI:MAKS
Maks Energy Solutions India
Engages in manufacturing, supplying, selling, installing, servicing, hiring, and commissioning of diesel generator sets and earth moving equipment in India.
Moderate with mediocre balance sheet.
Market Insights

Community Narratives

