

Legendary fund manager Li Lu (who Charlie Munger backed) once said, 'The biggest investment risk is not the volatility of prices, but whether you will suffer a permanent loss of capital.' So it might be obvious that you need to consider debt, when you think about how risky any given stock is, because too much debt can sink a company. We can see that KEI Industries Limited (NSE:KEI) does use debt in its business. But is this debt a concern to shareholders?
When Is Debt Dangerous?
Debt assists a business until the business has trouble paying it off, either with new capital or with free cash flow. If things get really bad, the lenders can take control of the business. While that is not too common, we often do see indebted companies permanently diluting shareholders because lenders force them to raise capital at a distressed price. Of course, plenty of companies use debt to fund growth, without any negative consequences. When we think about a company's use of debt, we first look at cash and debt together.
See our latest analysis for KEI Industries
How Much Debt Does KEI Industries Carry?
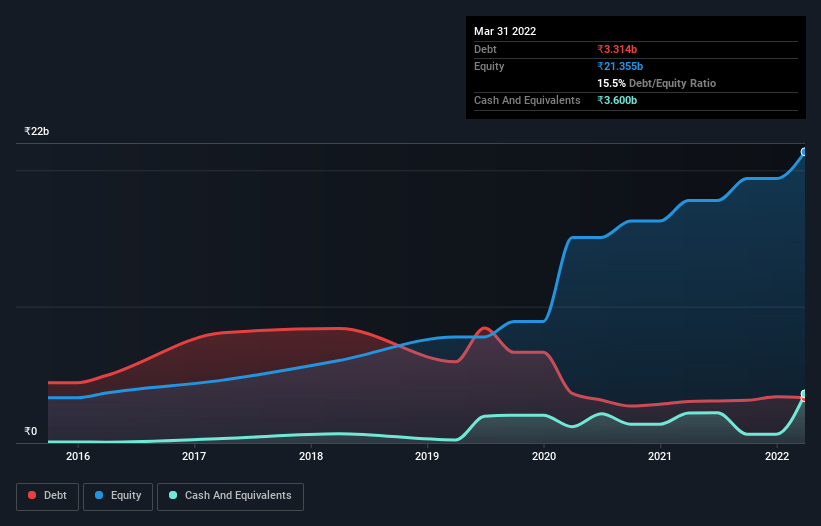
The image below, which you can click on for greater detail, shows that at March 2022 KEI Industries had debt of ₹3.31b, up from ₹3.04b in one year. But it also has ₹3.60b in cash to offset that, meaning it has ₹286.7m net cash.
A Look At KEI Industries' Liabilities
According to the last reported balance sheet, KEI Industries had liabilities of ₹13.3b due within 12 months, and liabilities of ₹588.9m due beyond 12 months. Offsetting this, it had ₹3.60b in cash and ₹14.2b in receivables that were due within 12 months. So it can boast ₹3.93b more liquid assets than total liabilities.
This short term liquidity is a sign that KEI Industries could probably pay off its debt with ease, as its balance sheet is far from stretched. Succinctly put, KEI Industries boasts net cash, so it's fair to say it does not have a heavy debt load!
On top of that, KEI Industries grew its EBIT by 32% over the last twelve months, and that growth will make it easier to handle its debt. When analysing debt levels, the balance sheet is the obvious place to start. But ultimately the future profitability of the business will decide if KEI Industries can strengthen its balance sheet over time. So if you're focused on the future you can check out this free report showing analyst profit forecasts.
But our final consideration is also important, because a company cannot pay debt with paper profits; it needs cold hard cash. While KEI Industries has net cash on its balance sheet, it's still worth taking a look at its ability to convert earnings before interest and tax (EBIT) to free cash flow, to help us understand how quickly it is building (or eroding) that cash balance. In the last three years, KEI Industries created free cash flow amounting to 15% of its EBIT, an uninspiring performance. That limp level of cash conversion undermines its ability to manage and pay down debt.
Summing up
While we empathize with investors who find debt concerning, you should keep in mind that KEI Industries has net cash of ₹286.7m, as well as more liquid assets than liabilities. And we liked the look of last year's 32% year-on-year EBIT growth. So is KEI Industries's debt a risk? It doesn't seem so to us. When analysing debt levels, the balance sheet is the obvious place to start. But ultimately, every company can contain risks that exist outside of the balance sheet. Be aware that KEI Industries is showing 1 warning sign in our investment analysis , you should know about...
At the end of the day, it's often better to focus on companies that are free from net debt. You can access our special list of such companies (all with a track record of profit growth). It's free.
Valuation is complex, but we're here to simplify it.
Discover if KEI Industries might be undervalued or overvalued with our detailed analysis, featuring fair value estimates, potential risks, dividends, insider trades, and its financial condition.
Access Free AnalysisHave feedback on this article? Concerned about the content? Get in touch with us directly. Alternatively, email editorial-team (at) simplywallst.com.
This article by Simply Wall St is general in nature. We provide commentary based on historical data and analyst forecasts only using an unbiased methodology and our articles are not intended to be financial advice. It does not constitute a recommendation to buy or sell any stock, and does not take account of your objectives, or your financial situation. We aim to bring you long-term focused analysis driven by fundamental data. Note that our analysis may not factor in the latest price-sensitive company announcements or qualitative material. Simply Wall St has no position in any stocks mentioned.
About NSEI:KEI
KEI Industries
Manufactures, sells, and markets wires and cables in India and internationally.
Flawless balance sheet with reasonable growth potential.
Similar Companies
Market Insights

Community Narratives


