
Advertisement

Howard Marks put it nicely when he said that, rather than worrying about share price volatility, 'The possibility of permanent loss is the risk I worry about... and every practical investor I know worries about.' When we think about how risky a company is, we always like to look at its use of debt, since debt overload can lead to ruin. We note that KEI Industries Limited (NSE:KEI) does have debt on its balance sheet. But the more important question is: how much risk is that debt creating?
Why Does Debt Bring Risk?
Debt assists a business until the business has trouble paying it off, either with new capital or with free cash flow. If things get really bad, the lenders can take control of the business. While that is not too common, we often do see indebted companies permanently diluting shareholders because lenders force them to raise capital at a distressed price. Of course, plenty of companies use debt to fund growth, without any negative consequences. The first thing to do when considering how much debt a business uses is to look at its cash and debt together.
View our latest analysis for KEI Industries
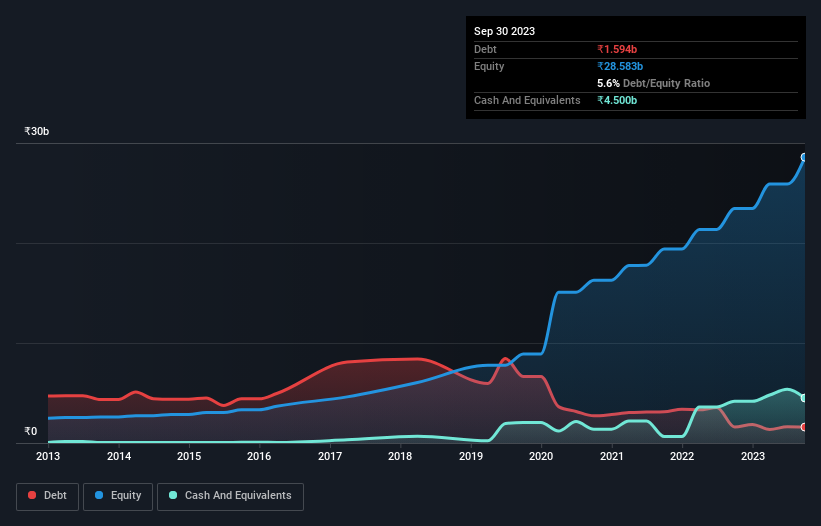
How Much Debt Does KEI Industries Carry?
The chart below, which you can click on for greater detail, shows that KEI Industries had ₹1.59b in debt in September 2023; about the same as the year before. But it also has ₹4.50b in cash to offset that, meaning it has ₹2.91b net cash.
How Healthy Is KEI Industries' Balance Sheet?
According to the last reported balance sheet, KEI Industries had liabilities of ₹11.7b due within 12 months, and liabilities of ₹715.6m due beyond 12 months. Offsetting this, it had ₹4.50b in cash and ₹12.9b in receivables that were due within 12 months. So it can boast ₹5.02b more liquid assets than total liabilities.
This short term liquidity is a sign that KEI Industries could probably pay off its debt with ease, as its balance sheet is far from stretched. Succinctly put, KEI Industries boasts net cash, so it's fair to say it does not have a heavy debt load!
And we also note warmly that KEI Industries grew its EBIT by 20% last year, making its debt load easier to handle. There's no doubt that we learn most about debt from the balance sheet. But it is future earnings, more than anything, that will determine KEI Industries's ability to maintain a healthy balance sheet going forward. So if you want to see what the professionals think, you might find this free report on analyst profit forecasts to be interesting.
Finally, a business needs free cash flow to pay off debt; accounting profits just don't cut it. KEI Industries may have net cash on the balance sheet, but it is still interesting to look at how well the business converts its earnings before interest and tax (EBIT) to free cash flow, because that will influence both its need for, and its capacity to manage debt. Looking at the most recent three years, KEI Industries recorded free cash flow of 33% of its EBIT, which is weaker than we'd expect. That weak cash conversion makes it more difficult to handle indebtedness.
Summing Up
While it is always sensible to investigate a company's debt, in this case KEI Industries has ₹2.91b in net cash and a decent-looking balance sheet. And we liked the look of last year's 20% year-on-year EBIT growth. So we don't think KEI Industries's use of debt is risky. Of course, we wouldn't say no to the extra confidence that we'd gain if we knew that KEI Industries insiders have been buying shares: if you're on the same wavelength, you can find out if insiders are buying by clicking this link.
If, after all that, you're more interested in a fast growing company with a rock-solid balance sheet, then check out our list of net cash growth stocks without delay.
Valuation is complex, but we're here to simplify it.
Discover if KEI Industries might be undervalued or overvalued with our detailed analysis, featuring fair value estimates, potential risks, dividends, insider trades, and its financial condition.
Access Free AnalysisHave feedback on this article? Concerned about the content? Get in touch with us directly. Alternatively, email editorial-team (at) simplywallst.com.
This article by Simply Wall St is general in nature. We provide commentary based on historical data and analyst forecasts only using an unbiased methodology and our articles are not intended to be financial advice. It does not constitute a recommendation to buy or sell any stock, and does not take account of your objectives, or your financial situation. We aim to bring you long-term focused analysis driven by fundamental data. Note that our analysis may not factor in the latest price-sensitive company announcements or qualitative material. Simply Wall St has no position in any stocks mentioned.
About NSEI:KEI
KEI Industries
Manufactures, sells, and markets wires and cables in India and internationally.
Flawless balance sheet with limited growth.
Similar Companies
Market Insights

Advertisement
Community Narratives
Groundbreaking therapies that could change the treatment landscape for PTSD, fibromyalgia, MS & Alzheimer’s
Fair Value US$6.20|86.9% undervalued
CM
Community Contributor
DigitalOcean Will Grow 14% by Embracing AI with Paperspace Acquisition
Fair Value US$50.00|41.7% undervalued
NE
Community Contributor
Viant Technology: A Rising AdTech Challenger in the AI-Powered CTV Market
Fair Value US$38.61|63.2% undervalued
BL
Community Contributor
Volvo will Accelerate Forward into Electric and Autonomous Leadership in Five Years
Fair Value SEK 438.80|39.7% undervalued
UN
Community Contributor