
Advertisement
There May Be Underlying Issues With The Quality Of Jamna Auto Industries' (NSE:JAMNAAUTO) Earnings
Jamna Auto Industries Limited's (NSE:JAMNAAUTO) robust earnings report didn't manage to move the market for its stock. We did some digging, and we found some concerning factors in the details.
See our latest analysis for Jamna Auto Industries
Zooming In On Jamna Auto Industries' Earnings
One key financial ratio used to measure how well a company converts its profit to free cash flow (FCF) is the accrual ratio. To get the accrual ratio we first subtract FCF from profit for a period, and then divide that number by the average operating assets for the period. This ratio tells us how much of a company's profit is not backed by free cashflow.
As a result, a negative accrual ratio is a positive for the company, and a positive accrual ratio is a negative. While it's not a problem to have a positive accrual ratio, indicating a certain level of non-cash profits, a high accrual ratio is arguably a bad thing, because it indicates paper profits are not matched by cash flow. That's because some academic studies have suggested that high accruals ratios tend to lead to lower profit or less profit growth.
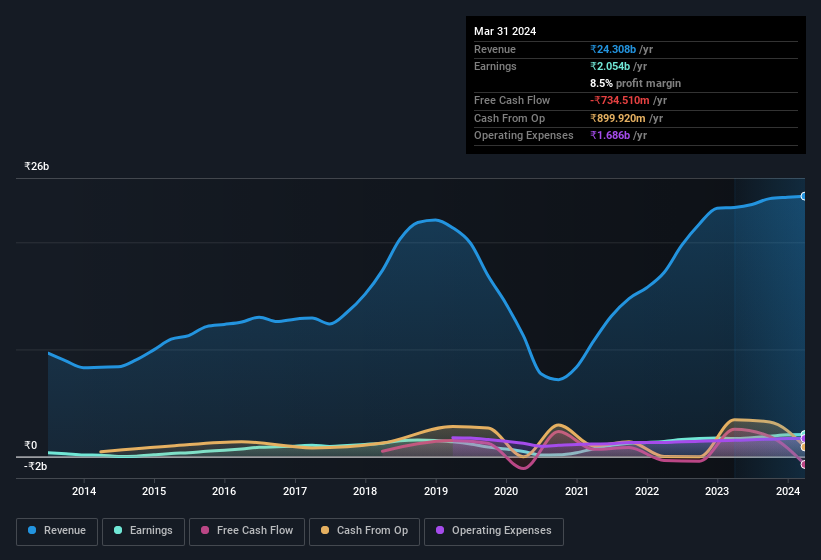
Over the twelve months to March 2024, Jamna Auto Industries recorded an accrual ratio of 0.32. We can therefore deduce that its free cash flow fell well short of covering its statutory profit, suggesting we might want to think twice before putting a lot of weight on the latter. Even though it reported a profit of ₹2.05b, a look at free cash flow indicates it actually burnt through ₹735m in the last year. It's worth noting that Jamna Auto Industries generated positive FCF of ₹2.6b a year ago, so at least they've done it in the past. The good news for shareholders is that Jamna Auto Industries' accrual ratio was much better last year, so this year's poor reading might simply be a case of a short term mismatch between profit and FCF. Shareholders should look for improved cashflow relative to profit in the current year, if that is indeed the case.
That might leave you wondering what analysts are forecasting in terms of future profitability. Luckily, you can click here to see an interactive graph depicting future profitability, based on their estimates.
Our Take On Jamna Auto Industries' Profit Performance
As we have made quite clear, we're a bit worried that Jamna Auto Industries didn't back up the last year's profit with free cashflow. For this reason, we think that Jamna Auto Industries' statutory profits may be a bad guide to its underlying earnings power, and might give investors an overly positive impression of the company. But on the bright side, its earnings per share have grown at an extremely impressive rate over the last three years. Of course, we've only just scratched the surface when it comes to analysing its earnings; one could also consider margins, forecast growth, and return on investment, among other factors. Keep in mind, when it comes to analysing a stock it's worth noting the risks involved. To that end, you should learn about the 2 warning signs we've spotted with Jamna Auto Industries (including 1 which shouldn't be ignored).
Today we've zoomed in on a single data point to better understand the nature of Jamna Auto Industries' profit. But there is always more to discover if you are capable of focussing your mind on minutiae. Some people consider a high return on equity to be a good sign of a quality business. While it might take a little research on your behalf, you may find this free collection of companies boasting high return on equity, or this list of stocks with significant insider holdings to be useful.
New: Manage All Your Stock Portfolios in One Place
We've created the ultimate portfolio companion for stock investors, and it's free.
• Connect an unlimited number of Portfolios and see your total in one currency
• Be alerted to new Warning Signs or Risks via email or mobile
• Track the Fair Value of your stocks
Have feedback on this article? Concerned about the content? Get in touch with us directly. Alternatively, email editorial-team (at) simplywallst.com.
This article by Simply Wall St is general in nature. We provide commentary based on historical data and analyst forecasts only using an unbiased methodology and our articles are not intended to be financial advice. It does not constitute a recommendation to buy or sell any stock, and does not take account of your objectives, or your financial situation. We aim to bring you long-term focused analysis driven by fundamental data. Note that our analysis may not factor in the latest price-sensitive company announcements or qualitative material. Simply Wall St has no position in any stocks mentioned.
About NSEI:JAMNAAUTO
Jamna Auto Industries
Engages in the manufacture and sale of tapered leaf, parabolic springs, and lift axles under the JAI brand in India and internationally.
Undervalued with excellent balance sheet and pays a dividend.
Similar Companies
Market Insights

Advertisement
Community Narratives
Finding The True Value Of A Logistics Powerhouse
Fair Value US$95.21|7.5% undervalued
NV
Community Contributor
Paradigm Biopharmaceuticals Will Lead Osteoarthritis Treatment with Zilosul's FDA Success
Fair Value AU$5.50|91.8% undervalued
AM
Community Contributor
Barrick Mining (ABX:CA): A Gold Hedge against a U.S. Shutdown
Fair Value CA$60.00|26.4% undervalued
GM
Community Contributor