Calculating The Fair Value Of Honda India Power Products Limited (NSE:HONDAPOWER)


Today we will run through one way of estimating the intrinsic value of Honda India Power Products Limited (NSE:HONDAPOWER) by estimating the company's future cash flows and discounting them to their present value. Our analysis will employ the Discounted Cash Flow (DCF) model. Models like these may appear beyond the comprehension of a lay person, but they're fairly easy to follow.
Remember though, that there are many ways to estimate a company's value, and a DCF is just one method. If you still have some burning questions about this type of valuation, take a look at the Simply Wall St analysis model.
Check out our latest analysis for Honda India Power Products
Step By Step Through The Calculation
We are going to use a two-stage DCF model, which, as the name states, takes into account two stages of growth. The first stage is generally a higher growth period which levels off heading towards the terminal value, captured in the second 'steady growth' period. In the first stage we need to estimate the cash flows to the business over the next ten years. Seeing as no analyst estimates of free cash flow are available to us, we have extrapolate the previous free cash flow (FCF) from the company's last reported value. We assume companies with shrinking free cash flow will slow their rate of shrinkage, and that companies with growing free cash flow will see their growth rate slow, over this period. We do this to reflect that growth tends to slow more in the early years than it does in later years.
A DCF is all about the idea that a dollar in the future is less valuable than a dollar today, so we discount the value of these future cash flows to their estimated value in today's dollars:
10-year free cash flow (FCF) forecast
| 2023 | 2024 | 2025 | 2026 | 2027 | 2028 | 2029 | 2030 | 2031 | 2032 | |
| Levered FCF (₹, Millions) | ₹1.57b | ₹1.88b | ₹2.17b | ₹2.46b | ₹2.73b | ₹3.00b | ₹3.27b | ₹3.55b | ₹3.82b | ₹4.11b |
| Growth Rate Estimate Source | Est @ 25.25% | Est @ 19.71% | Est @ 15.84% | Est @ 13.12% | Est @ 11.22% | Est @ 9.89% | Est @ 8.96% | Est @ 8.31% | Est @ 7.85% | Est @ 7.53% |
| Present Value (₹, Millions) Discounted @ 15% | ₹1.4k | ₹1.4k | ₹1.4k | ₹1.4k | ₹1.4k | ₹1.3k | ₹1.2k | ₹1.1k | ₹1.1k | ₹1.0k |
("Est" = FCF growth rate estimated by Simply Wall St)
Present Value of 10-year Cash Flow (PVCF) = ₹13b
We now need to calculate the Terminal Value, which accounts for all the future cash flows after this ten year period. For a number of reasons a very conservative growth rate is used that cannot exceed that of a country's GDP growth. In this case we have used the 5-year average of the 10-year government bond yield (6.8%) to estimate future growth. In the same way as with the 10-year 'growth' period, we discount future cash flows to today's value, using a cost of equity of 15%.
Terminal Value (TV)= FCF2032 × (1 + g) ÷ (r – g) = ₹4.1b× (1 + 6.8%) ÷ (15%– 6.8%) = ₹53b
Present Value of Terminal Value (PVTV)= TV / (1 + r)10= ₹53b÷ ( 1 + 15%)10= ₹13b
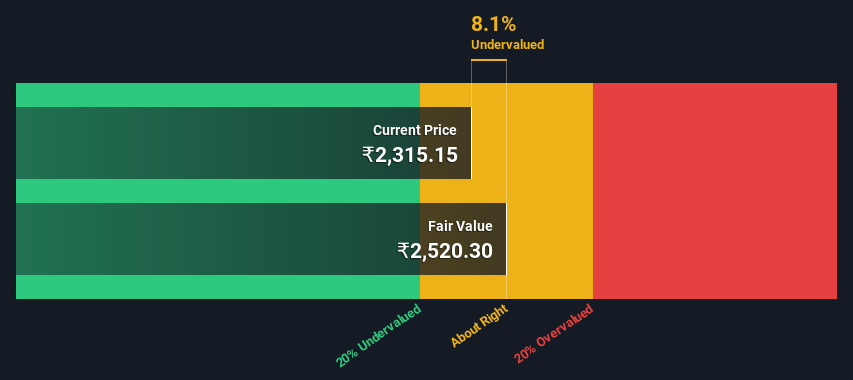
The total value, or equity value, is then the sum of the present value of the future cash flows, which in this case is ₹26b. To get the intrinsic value per share, we divide this by the total number of shares outstanding. Relative to the current share price of ₹2.3k, the company appears about fair value at a 8.1% discount to where the stock price trades currently. The assumptions in any calculation have a big impact on the valuation, so it is better to view this as a rough estimate, not precise down to the last cent.
The Assumptions
The calculation above is very dependent on two assumptions. The first is the discount rate and the other is the cash flows. Part of investing is coming up with your own evaluation of a company's future performance, so try the calculation yourself and check your own assumptions. The DCF also does not consider the possible cyclicality of an industry, or a company's future capital requirements, so it does not give a full picture of a company's potential performance. Given that we are looking at Honda India Power Products as potential shareholders, the cost of equity is used as the discount rate, rather than the cost of capital (or weighted average cost of capital, WACC) which accounts for debt. In this calculation we've used 15%, which is based on a levered beta of 0.989. Beta is a measure of a stock's volatility, compared to the market as a whole. We get our beta from the industry average beta of globally comparable companies, with an imposed limit between 0.8 and 2.0, which is a reasonable range for a stable business.
SWOT Analysis for Honda India Power Products
- Earnings growth over the past year exceeded its 5-year average.
- Currently debt free.
- Dividends are covered by earnings and cash flows.
- Earnings growth over the past year underperformed the Machinery industry.
- Dividend is low compared to the top 25% of dividend payers in the Machinery market.
- Current share price is below our estimate of fair value.
- Lack of analyst coverage makes it difficult to determine HONDAPOWER's earnings prospects.
- No apparent threats visible for HONDAPOWER.
Moving On:
Valuation is only one side of the coin in terms of building your investment thesis, and it is only one of many factors that you need to assess for a company. The DCF model is not a perfect stock valuation tool. Rather it should be seen as a guide to "what assumptions need to be true for this stock to be under/overvalued?" If a company grows at a different rate, or if its cost of equity or risk free rate changes sharply, the output can look very different. For Honda India Power Products, there are three relevant elements you should explore:
- Risks: To that end, you should be aware of the 2 warning signs we've spotted with Honda India Power Products .
- Other Solid Businesses: Low debt, high returns on equity and good past performance are fundamental to a strong business. Why not explore our interactive list of stocks with solid business fundamentals to see if there are other companies you may not have considered!
- Other Environmentally-Friendly Companies: Concerned about the environment and think consumers will buy eco-friendly products more and more? Browse through our interactive list of companies that are thinking about a greener future to discover some stocks you may not have thought of!
PS. The Simply Wall St app conducts a discounted cash flow valuation for every stock on the NSEI every day. If you want to find the calculation for other stocks just search here.
If you're looking to trade Honda India Power Products, open an account with the lowest-cost platform trusted by professionals, Interactive Brokers.
With clients in over 200 countries and territories, and access to 160 markets, IBKR lets you trade stocks, options, futures, forex, bonds and funds from a single integrated account.
Enjoy no hidden fees, no account minimums, and FX conversion rates as low as 0.03%, far better than what most brokers offer.
Sponsored ContentValuation is complex, but we're here to simplify it.
Discover if Honda India Power Products might be undervalued or overvalued with our detailed analysis, featuring fair value estimates, potential risks, dividends, insider trades, and its financial condition.
Access Free AnalysisHave feedback on this article? Concerned about the content? Get in touch with us directly. Alternatively, email editorial-team (at) simplywallst.com.
This article by Simply Wall St is general in nature. We provide commentary based on historical data and analyst forecasts only using an unbiased methodology and our articles are not intended to be financial advice. It does not constitute a recommendation to buy or sell any stock, and does not take account of your objectives, or your financial situation. We aim to bring you long-term focused analysis driven by fundamental data. Note that our analysis may not factor in the latest price-sensitive company announcements or qualitative material. Simply Wall St has no position in any stocks mentioned.
About NSEI:HONDAPOWER
Honda India Power Products
Engages in the manufacture, marketing, and sale of portable generators, water pumps, general purpose engines, lawn mowers, brush cutters, portable gensets, tillers, and marine engines in India and internationally.
Flawless balance sheet average dividend payer.
Market Insights

Community Narratives

