- India
- /
- Aerospace & Defense
- /
- NSEI:HAL
Calculating The Fair Value Of Hindustan Aeronautics Limited (NSE:HAL)


Key Insights
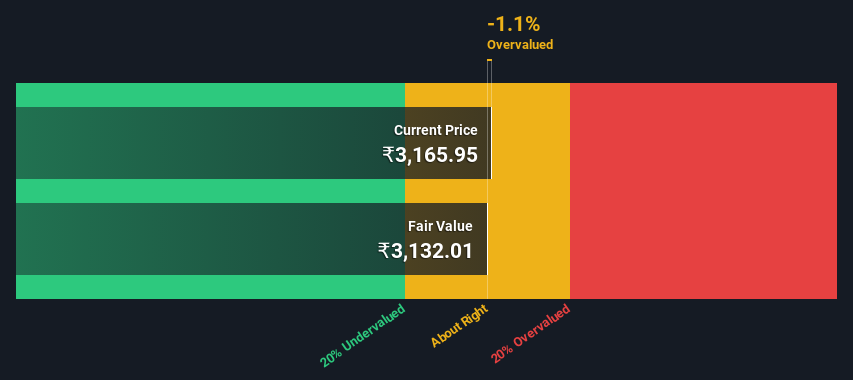
- Hindustan Aeronautics' estimated fair value is ₹3,132 based on 2 Stage Free Cash Flow to Equity
- Current share price of ₹3,166 suggests Hindustan Aeronautics is potentially trading close to its fair value
- The ₹2,892 analyst price target for HAL is 7.7% less than our estimate of fair value
In this article we are going to estimate the intrinsic value of Hindustan Aeronautics Limited (NSE:HAL) by taking the expected future cash flows and discounting them to their present value. Our analysis will employ the Discounted Cash Flow (DCF) model. Believe it or not, it's not too difficult to follow, as you'll see from our example!
Companies can be valued in a lot of ways, so we would point out that a DCF is not perfect for every situation. Anyone interested in learning a bit more about intrinsic value should have a read of the Simply Wall St analysis model.
See our latest analysis for Hindustan Aeronautics
The Method
We use what is known as a 2-stage model, which simply means we have two different periods of growth rates for the company's cash flows. Generally the first stage is higher growth, and the second stage is a lower growth phase. In the first stage we need to estimate the cash flows to the business over the next ten years. Where possible we use analyst estimates, but when these aren't available we extrapolate the previous free cash flow (FCF) from the last estimate or reported value. We assume companies with shrinking free cash flow will slow their rate of shrinkage, and that companies with growing free cash flow will see their growth rate slow, over this period. We do this to reflect that growth tends to slow more in the early years than it does in later years.
A DCF is all about the idea that a dollar in the future is less valuable than a dollar today, so we discount the value of these future cash flows to their estimated value in today's dollars:
10-year free cash flow (FCF) estimate
| 2024 | 2025 | 2026 | 2027 | 2028 | 2029 | 2030 | 2031 | 2032 | 2033 | |
| Levered FCF (₹, Millions) | ₹41.3b | ₹57.9b | ₹91.0b | ₹119.0b | ₹147.0b | ₹174.1b | ₹200.1b | ₹225.0b | ₹249.2b | ₹273.0b |
| Growth Rate Estimate Source | Analyst x3 | Analyst x4 | Analyst x4 | Est @ 30.70% | Est @ 23.50% | Est @ 18.46% | Est @ 14.94% | Est @ 12.47% | Est @ 10.74% | Est @ 9.53% |
| Present Value (₹, Millions) Discounted @ 13% | ₹36.6k | ₹45.4k | ₹63.2k | ₹73.1k | ₹79.9k | ₹83.8k | ₹85.3k | ₹84.9k | ₹83.2k | ₹80.7k |
("Est" = FCF growth rate estimated by Simply Wall St)
Present Value of 10-year Cash Flow (PVCF) = ₹716b
After calculating the present value of future cash flows in the initial 10-year period, we need to calculate the Terminal Value, which accounts for all future cash flows beyond the first stage. For a number of reasons a very conservative growth rate is used that cannot exceed that of a country's GDP growth. In this case we have used the 5-year average of the 10-year government bond yield (6.7%) to estimate future growth. In the same way as with the 10-year 'growth' period, we discount future cash flows to today's value, using a cost of equity of 13%.
Terminal Value (TV)= FCF2033 × (1 + g) ÷ (r – g) = ₹273b× (1 + 6.7%) ÷ (13%– 6.7%) = ₹4.7t
Present Value of Terminal Value (PVTV)= TV / (1 + r)10= ₹4.7t÷ ( 1 + 13%)10= ₹1.4t
The total value, or equity value, is then the sum of the present value of the future cash flows, which in this case is ₹2.1t. The last step is to then divide the equity value by the number of shares outstanding. Compared to the current share price of ₹3.2k, the company appears around fair value at the time of writing. Valuations are imprecise instruments though, rather like a telescope - move a few degrees and end up in a different galaxy. Do keep this in mind.
The Assumptions
Now the most important inputs to a discounted cash flow are the discount rate, and of course, the actual cash flows. You don't have to agree with these inputs, I recommend redoing the calculations yourself and playing with them. The DCF also does not consider the possible cyclicality of an industry, or a company's future capital requirements, so it does not give a full picture of a company's potential performance. Given that we are looking at Hindustan Aeronautics as potential shareholders, the cost of equity is used as the discount rate, rather than the cost of capital (or weighted average cost of capital, WACC) which accounts for debt. In this calculation we've used 13%, which is based on a levered beta of 0.800. Beta is a measure of a stock's volatility, compared to the market as a whole. We get our beta from the industry average beta of globally comparable companies, with an imposed limit between 0.8 and 2.0, which is a reasonable range for a stable business.
SWOT Analysis for Hindustan Aeronautics
- Debt is not viewed as a risk.
- Dividends are covered by earnings and cash flows.
- Earnings growth over the past year underperformed the Aerospace & Defense industry.
- Dividend is low compared to the top 25% of dividend payers in the Aerospace & Defense market.
- Annual revenue is forecast to grow faster than the Indian market.
- Good value based on P/E ratio compared to estimated Fair P/E ratio.
- Annual earnings are forecast to grow slower than the Indian market.
Moving On:
Valuation is only one side of the coin in terms of building your investment thesis, and it shouldn't be the only metric you look at when researching a company. DCF models are not the be-all and end-all of investment valuation. Preferably you'd apply different cases and assumptions and see how they would impact the company's valuation. For example, changes in the company's cost of equity or the risk free rate can significantly impact the valuation. For Hindustan Aeronautics, there are three essential elements you should consider:
- Risks: Every company has them, and we've spotted 1 warning sign for Hindustan Aeronautics you should know about.
- Future Earnings: How does HAL's growth rate compare to its peers and the wider market? Dig deeper into the analyst consensus number for the upcoming years by interacting with our free analyst growth expectation chart.
- Other High Quality Alternatives: Do you like a good all-rounder? Explore our interactive list of high quality stocks to get an idea of what else is out there you may be missing!
PS. Simply Wall St updates its DCF calculation for every Indian stock every day, so if you want to find the intrinsic value of any other stock just search here.
Valuation is complex, but we're here to simplify it.
Discover if Hindustan Aeronautics might be undervalued or overvalued with our detailed analysis, featuring fair value estimates, potential risks, dividends, insider trades, and its financial condition.
Access Free AnalysisHave feedback on this article? Concerned about the content? Get in touch with us directly. Alternatively, email editorial-team (at) simplywallst.com.
This article by Simply Wall St is general in nature. We provide commentary based on historical data and analyst forecasts only using an unbiased methodology and our articles are not intended to be financial advice. It does not constitute a recommendation to buy or sell any stock, and does not take account of your objectives, or your financial situation. We aim to bring you long-term focused analysis driven by fundamental data. Note that our analysis may not factor in the latest price-sensitive company announcements or qualitative material. Simply Wall St has no position in any stocks mentioned.
About NSEI:HAL
Hindustan Aeronautics
Engages in the design, development, manufacture, repair, overhaul, upgrade, and servicing of aircraft, helicopters, aero-engines, avionics, accessories, and aerospace structures in India and internationally.
Flawless balance sheet with solid track record.

