- India
- /
- Electrical
- /
- NSEI:GRAPHITE
Here's Why Graphite India (NSE:GRAPHITE) Can Manage Its Debt Responsibly


Warren Buffett famously said, 'Volatility is far from synonymous with risk.' When we think about how risky a company is, we always like to look at its use of debt, since debt overload can lead to ruin. We note that Graphite India Limited (NSE:GRAPHITE) does have debt on its balance sheet. But should shareholders be worried about its use of debt?
Why Does Debt Bring Risk?
Debt and other liabilities become risky for a business when it cannot easily fulfill those obligations, either with free cash flow or by raising capital at an attractive price. Ultimately, if the company can't fulfill its legal obligations to repay debt, shareholders could walk away with nothing. However, a more common (but still painful) scenario is that it has to raise new equity capital at a low price, thus permanently diluting shareholders. Of course, plenty of companies use debt to fund growth, without any negative consequences. The first thing to do when considering how much debt a business uses is to look at its cash and debt together.
Check out our latest analysis for Graphite India
What Is Graphite India's Debt?
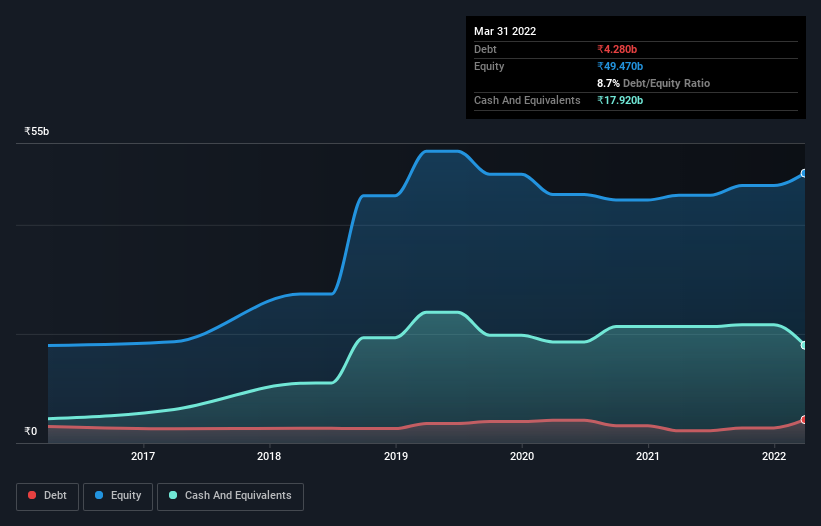
The image below, which you can click on for greater detail, shows that at March 2022 Graphite India had debt of ₹4.28b, up from ₹2.23b in one year. However, its balance sheet shows it holds ₹17.9b in cash, so it actually has ₹13.6b net cash.
A Look At Graphite India's Liabilities
The latest balance sheet data shows that Graphite India had liabilities of ₹12.2b due within a year, and liabilities of ₹1.31b falling due after that. Offsetting this, it had ₹17.9b in cash and ₹5.41b in receivables that were due within 12 months. So it actually has ₹9.81b more liquid assets than total liabilities.
This surplus suggests that Graphite India has a conservative balance sheet, and could probably eliminate its debt without much difficulty. Succinctly put, Graphite India boasts net cash, so it's fair to say it does not have a heavy debt load!
It was also good to see that despite losing money on the EBIT line last year, Graphite India turned things around in the last 12 months, delivering and EBIT of ₹4.2b. There's no doubt that we learn most about debt from the balance sheet. But it is future earnings, more than anything, that will determine Graphite India's ability to maintain a healthy balance sheet going forward. So if you're focused on the future you can check out this free report showing analyst profit forecasts.
Finally, while the tax-man may adore accounting profits, lenders only accept cold hard cash. While Graphite India has net cash on its balance sheet, it's still worth taking a look at its ability to convert earnings before interest and tax (EBIT) to free cash flow, to help us understand how quickly it is building (or eroding) that cash balance. During the last year, Graphite India burned a lot of cash. While that may be a result of expenditure for growth, it does make the debt far more risky.
Summing up
While it is always sensible to investigate a company's debt, in this case Graphite India has ₹13.6b in net cash and a decent-looking balance sheet. So we are not troubled with Graphite India's debt use. When analysing debt levels, the balance sheet is the obvious place to start. But ultimately, every company can contain risks that exist outside of the balance sheet. To that end, you should learn about the 3 warning signs we've spotted with Graphite India (including 1 which is a bit concerning) .
At the end of the day, it's often better to focus on companies that are free from net debt. You can access our special list of such companies (all with a track record of profit growth). It's free.
New: Manage All Your Stock Portfolios in One Place
We've created the ultimate portfolio companion for stock investors, and it's free.
• Connect an unlimited number of Portfolios and see your total in one currency
• Be alerted to new Warning Signs or Risks via email or mobile
• Track the Fair Value of your stocks
Have feedback on this article? Concerned about the content? Get in touch with us directly. Alternatively, email editorial-team (at) simplywallst.com.
This article by Simply Wall St is general in nature. We provide commentary based on historical data and analyst forecasts only using an unbiased methodology and our articles are not intended to be financial advice. It does not constitute a recommendation to buy or sell any stock, and does not take account of your objectives, or your financial situation. We aim to bring you long-term focused analysis driven by fundamental data. Note that our analysis may not factor in the latest price-sensitive company announcements or qualitative material. Simply Wall St has no position in any stocks mentioned.
About NSEI:GRAPHITE
Graphite India
Manufactures and sells graphite electrodes, and carbon and graphite specialty products in India and internationally.
Flawless balance sheet, undervalued and pays a dividend.

