- India
- /
- Industrials
- /
- NSEI:GODREJIND
Optimistic Investors Push Godrej Industries Limited (NSE:GODREJIND) Shares Up 31% But Growth Is Lacking


Despite an already strong run, Godrej Industries Limited (NSE:GODREJIND) shares have been powering on, with a gain of 31% in the last thirty days. The last month tops off a massive increase of 123% in the last year.
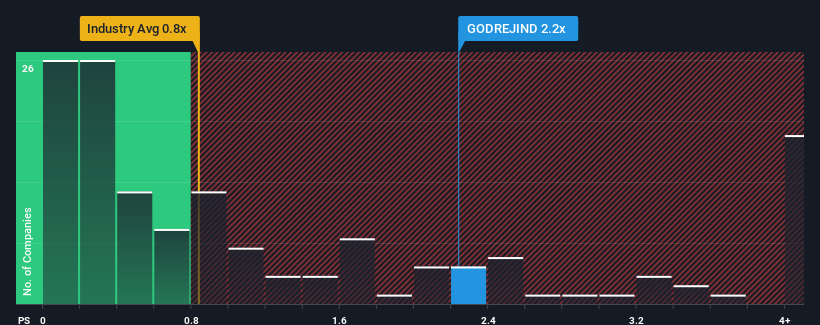
In spite of the firm bounce in price, it's still not a stretch to say that Godrej Industries' price-to-sales (or "P/S") ratio of 2.2x right now seems quite "middle-of-the-road" compared to the Industrials industry in India, seeing as it matches the P/S ratio of the wider industry. While this might not raise any eyebrows, if the P/S ratio is not justified investors could be missing out on a potential opportunity or ignoring looming disappointment.
See our latest analysis for Godrej Industries
How Has Godrej Industries Performed Recently?
For instance, Godrej Industries' receding revenue in recent times would have to be some food for thought. One possibility is that the P/S is moderate because investors think the company might still do enough to be in line with the broader industry in the near future. If you like the company, you'd at least be hoping this is the case so that you could potentially pick up some stock while it's not quite in favour.
Want the full picture on earnings, revenue and cash flow for the company? Then our free report on Godrej Industries will help you shine a light on its historical performance.Is There Some Revenue Growth Forecasted For Godrej Industries?
Godrej Industries' P/S ratio would be typical for a company that's only expected to deliver moderate growth, and importantly, perform in line with the industry.
Taking a look back first, the company's revenue growth last year wasn't something to get excited about as it posted a disappointing decline of 2.1%. However, a few very strong years before that means that it was still able to grow revenue by an impressive 65% in total over the last three years. Accordingly, while they would have preferred to keep the run going, shareholders would definitely welcome the medium-term rates of revenue growth.
Comparing that to the industry, which is predicted to deliver 65% growth in the next 12 months, the company's momentum is weaker, based on recent medium-term annualised revenue results.
With this in mind, we find it intriguing that Godrej Industries' P/S is comparable to that of its industry peers. It seems most investors are ignoring the fairly limited recent growth rates and are willing to pay up for exposure to the stock. They may be setting themselves up for future disappointment if the P/S falls to levels more in line with recent growth rates.
The Key Takeaway
Godrej Industries appears to be back in favour with a solid price jump bringing its P/S back in line with other companies in the industry While the price-to-sales ratio shouldn't be the defining factor in whether you buy a stock or not, it's quite a capable barometer of revenue expectations.
Our examination of Godrej Industries revealed its poor three-year revenue trends aren't resulting in a lower P/S as per our expectations, given they look worse than current industry outlook. Right now we are uncomfortable with the P/S as this revenue performance isn't likely to support a more positive sentiment for long. If recent medium-term revenue trends continue, the probability of a share price decline will become quite substantial, placing shareholders at risk.
It is also worth noting that we have found 3 warning signs for Godrej Industries (1 is a bit concerning!) that you need to take into consideration.
If these risks are making you reconsider your opinion on Godrej Industries, explore our interactive list of high quality stocks to get an idea of what else is out there.
New: Manage All Your Stock Portfolios in One Place
We've created the ultimate portfolio companion for stock investors, and it's free.
• Connect an unlimited number of Portfolios and see your total in one currency
• Be alerted to new Warning Signs or Risks via email or mobile
• Track the Fair Value of your stocks
Have feedback on this article? Concerned about the content? Get in touch with us directly. Alternatively, email editorial-team (at) simplywallst.com.
This article by Simply Wall St is general in nature. We provide commentary based on historical data and analyst forecasts only using an unbiased methodology and our articles are not intended to be financial advice. It does not constitute a recommendation to buy or sell any stock, and does not take account of your objectives, or your financial situation. We aim to bring you long-term focused analysis driven by fundamental data. Note that our analysis may not factor in the latest price-sensitive company announcements or qualitative material. Simply Wall St has no position in any stocks mentioned.
About NSEI:GODREJIND
Godrej Industries
Engages in the chemical, consumer goods, real estate, agriculture, and financial services businesses in India and Internationally.
Low with imperfect balance sheet.
Similar Companies
Market Insights

Community Narratives


