- India
- /
- Industrials
- /
- NSEI:GODREJIND
Godrej Industries'(NSE:GODREJIND) Share Price Is Down 29% Over The Past Three Years.


Many investors define successful investing as beating the market average over the long term. But in any portfolio, there are likely to be some stocks that fall short of that benchmark. We regret to report that long term Godrej Industries Limited (NSE:GODREJIND) shareholders have had that experience, with the share price dropping 29% in three years, versus a market return of about 5.9%. On top of that, the share price is down 6.1% in the last week. But this could be related to the soft market, which is down about 2.6% in the same period.
Check out our latest analysis for Godrej Industries
There is no denying that markets are sometimes efficient, but prices do not always reflect underlying business performance. By comparing earnings per share (EPS) and share price changes over time, we can get a feel for how investor attitudes to a company have morphed over time.
During the unfortunate three years of share price decline, Godrej Industries actually saw its earnings per share (EPS) improve by 11% per year. This is quite a puzzle, and suggests there might be something temporarily buoying the share price. Alternatively, growth expectations may have been unreasonable in the past.
Since the change in EPS doesn't seem to correlate with the change in share price, it's worth taking a look at other metrics.
Revenue is actually up 7.6% over the three years, so the share price drop doesn't seem to hinge on revenue, either. This analysis is just perfunctory, but it might be worth researching Godrej Industries more closely, as sometimes stocks fall unfairly. This could present an opportunity.
The company's revenue and earnings (over time) are depicted in the image below (click to see the exact numbers).
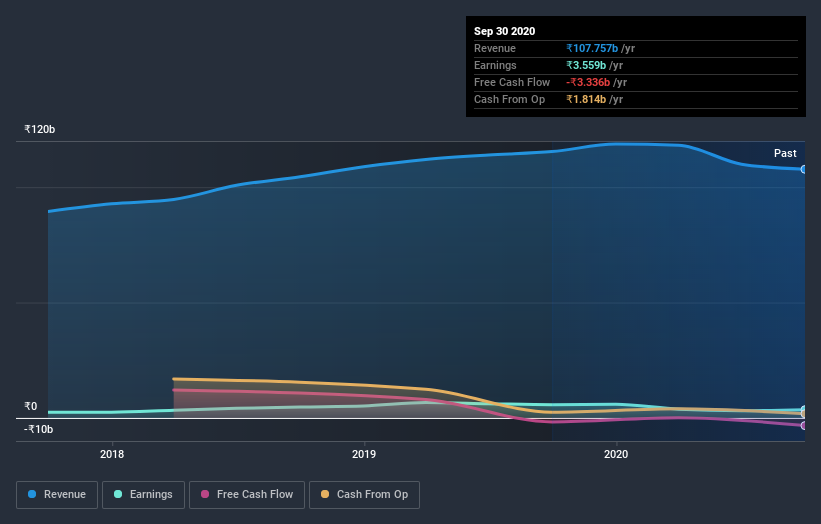
We like that insiders have been buying shares in the last twelve months. Having said that, most people consider earnings and revenue growth trends to be a more meaningful guide to the business. This free interactive report on Godrej Industries' earnings, revenue and cash flow is a great place to start, if you want to investigate the stock further.
A Different Perspective
Godrej Industries shareholders gained a total return of 1.9% during the year. Unfortunately this falls short of the market return. It's probably a good sign that the company has an even better long term track record, having provided shareholders with an annual TSR of 2% over five years. Maybe the share price is just taking a breather while the business executes on its growth strategy. It's always interesting to track share price performance over the longer term. But to understand Godrej Industries better, we need to consider many other factors. Like risks, for instance. Every company has them, and we've spotted 3 warning signs for Godrej Industries (of which 1 doesn't sit too well with us!) you should know about.
Godrej Industries is not the only stock insiders are buying. So take a peek at this free list of growing companies with insider buying.
Please note, the market returns quoted in this article reflect the market weighted average returns of stocks that currently trade on IN exchanges.
When trading Godrej Industries or any other investment, use the platform considered by many to be the Professional's Gateway to the Worlds Market, Interactive Brokers. You get the lowest-cost* trading on stocks, options, futures, forex, bonds and funds worldwide from a single integrated account. Promoted
New: Manage All Your Stock Portfolios in One Place
We've created the ultimate portfolio companion for stock investors, and it's free.
• Connect an unlimited number of Portfolios and see your total in one currency
• Be alerted to new Warning Signs or Risks via email or mobile
• Track the Fair Value of your stocks
This article by Simply Wall St is general in nature. It does not constitute a recommendation to buy or sell any stock, and does not take account of your objectives, or your financial situation. We aim to bring you long-term focused analysis driven by fundamental data. Note that our analysis may not factor in the latest price-sensitive company announcements or qualitative material. Simply Wall St has no position in any stocks mentioned.
*Interactive Brokers Rated Lowest Cost Broker by StockBrokers.com Annual Online Review 2020
Have feedback on this article? Concerned about the content? Get in touch with us directly. Alternatively, email editorial-team@simplywallst.com.
About NSEI:GODREJIND
Godrej Industries
Engages in the chemical, consumer goods, real estate, agriculture, and financial services businesses in India and Internationally.
Low with imperfect balance sheet.
Similar Companies
Market Insights

Community Narratives


