- India
- /
- Electrical
- /
- NSEI:ELECON
How Does Elecon Engineering's (NSE:ELECON) P/E Compare To Its Industry, After The Share Price Drop?

To the annoyance of some shareholders, Elecon Engineering (NSE:ELECON) shares are down a considerable 30% in the last month. Indeed the recent decline has arguably caused some bitterness for shareholders who have held through the 59% drop over twelve months.
All else being equal, a share price drop should make a stock more attractive to potential investors. While the market sentiment towards a stock is very changeable, in the long run, the share price will tend to move in the same direction as earnings per share. So, on certain occasions, long term focussed investors try to take advantage of pessimistic expectations to buy shares at a better price. One way to gauge market expectations of a stock is to look at its Price to Earnings Ratio (PE Ratio). Investors have optimistic expectations of companies with higher P/E ratios, compared to companies with lower P/E ratios.
See our latest analysis for Elecon Engineering
How Does Elecon Engineering's P/E Ratio Compare To Its Peers?
We can tell from its P/E ratio of 4.98 that sentiment around Elecon Engineering isn't particularly high. We can see in the image below that the average P/E (11.8) for companies in the electrical industry is higher than Elecon Engineering's P/E.
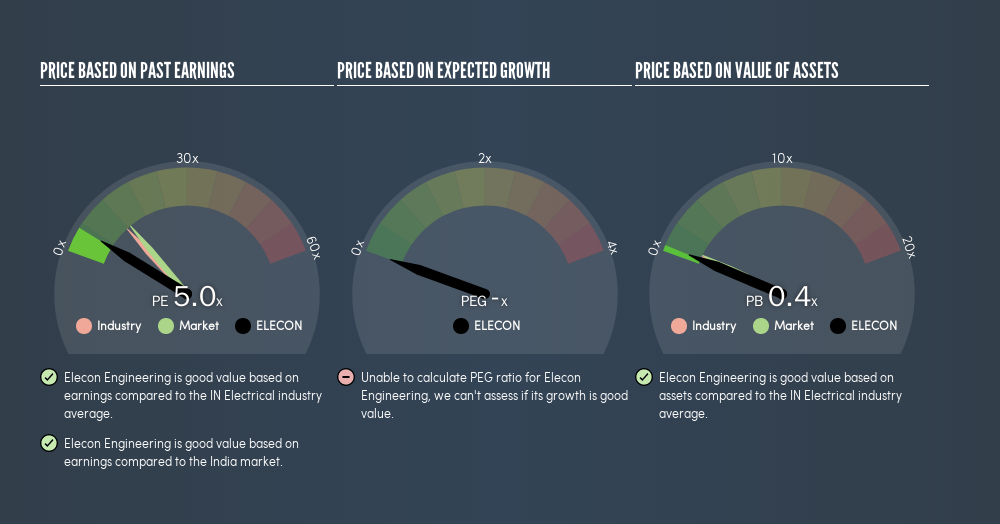
This suggests that market participants think Elecon Engineering will underperform other companies in its industry.
How Growth Rates Impact P/E Ratios
Generally speaking the rate of earnings growth has a profound impact on a company's P/E multiple. When earnings grow, the 'E' increases, over time. That means even if the current P/E is high, it will reduce over time if the share price stays flat. So while a stock may look expensive based on past earnings, it could be cheap based on future earnings.
Most would be impressed by Elecon Engineering earnings growth of 22% in the last year. And its annual EPS growth rate over 5 years is 35%. With that performance, you might expect an above average P/E ratio.
Remember: P/E Ratios Don't Consider The Balance Sheet
The 'Price' in P/E reflects the market capitalization of the company. That means it doesn't take debt or cash into account. Theoretically, a business can improve its earnings (and produce a lower P/E in the future) by investing in growth. That means taking on debt (or spending its cash).
Spending on growth might be good or bad a few years later, but the point is that the P/E ratio does not account for the option (or lack thereof).
How Does Elecon Engineering's Debt Impact Its P/E Ratio?
Elecon Engineering's net debt is 81% of its market cap. If you want to compare its P/E ratio to other companies, you should absolutely keep in mind it has significant borrowings.
The Verdict On Elecon Engineering's P/E Ratio
Elecon Engineering has a P/E of 5. That's below the average in the IN market, which is 13. The company has a meaningful amount of debt on the balance sheet, but that should not eclipse the solid earnings growth. If the company can continue to grow earnings, then the current P/E may be unjustifiably low. What can be absolutely certain is that the market has become more pessimistic about Elecon Engineering over the last month, with the P/E ratio falling from 7.2 back then to 5 today. For those who prefer invest in growth, this stock apparently offers limited promise, but the deep value investors may find the pessimism around this stock enticing.
Investors should be looking to buy stocks that the market is wrong about. As value investor Benjamin Graham famously said, 'In the short run, the market is a voting machine but in the long run, it is a weighing machine.' We don't have analyst forecasts, but you might want to assess this data-rich visualization of earnings, revenue and cash flow.
Of course you might be able to find a better stock than Elecon Engineering. So you may wish to see this free collection of other companies that have grown earnings strongly.
We aim to bring you long-term focused research analysis driven by fundamental data. Note that our analysis may not factor in the latest price-sensitive company announcements or qualitative material.
If you spot an error that warrants correction, please contact the editor at editorial-team@simplywallst.com. This article by Simply Wall St is general in nature. It does not constitute a recommendation to buy or sell any stock, and does not take account of your objectives, or your financial situation. Simply Wall St has no position in the stocks mentioned. Thank you for reading.
About NSEI:ELECON
Elecon Engineering
Manufactures and sells power transmission and material handling equipment in India and internationally.
Flawless balance sheet with proven track record and pays a dividend.
Similar Companies
Market Insights

Community Narratives

