- India
- /
- Electrical
- /
- NSEI:DIACABS
Diamond Power Infrastructure Limited (NSE:DIACABS) Looks Just Right With A 29% Price Jump
Despite an already strong run, Diamond Power Infrastructure Limited (NSE:DIACABS) shares have been powering on, with a gain of 29% in the last thirty days. While recent buyers may be laughing, long-term holders might not be as pleased since the recent gain only brings the stock back to where it started a year ago.
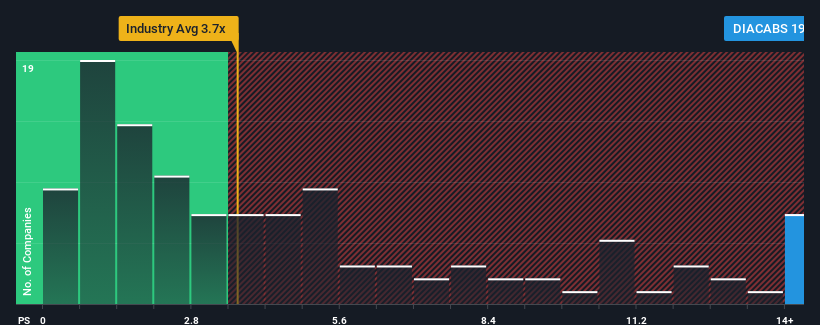
After such a large jump in price, Diamond Power Infrastructure may be sending strong sell signals at present with a price-to-sales (or "P/S") ratio of 19.8x, when you consider almost half of the companies in the Electrical industry in India have P/S ratios under 3.7x and even P/S lower than 1.4x aren't out of the ordinary. Nonetheless, we'd need to dig a little deeper to determine if there is a rational basis for the highly elevated P/S.
View our latest analysis for Diamond Power Infrastructure

How Has Diamond Power Infrastructure Performed Recently?
Diamond Power Infrastructure certainly has been doing a great job lately as it's been growing its revenue at a really rapid pace. Perhaps the market is expecting future revenue performance to outperform the wider market, which has seemingly got people interested in the stock. You'd really hope so, otherwise you're paying a pretty hefty price for no particular reason.
We don't have analyst forecasts, but you can see how recent trends are setting up the company for the future by checking out our free report on Diamond Power Infrastructure's earnings, revenue and cash flow.What Are Revenue Growth Metrics Telling Us About The High P/S?
Diamond Power Infrastructure's P/S ratio would be typical for a company that's expected to deliver very strong growth, and importantly, perform much better than the industry.
Taking a look back first, we see that the company's revenues underwent some rampant growth over the last 12 months. The latest three year period has also seen an incredible overall rise in revenue, aided by its incredible short-term performance. So we can start by confirming that the company has done a tremendous job of growing revenue over that time.
Comparing that recent medium-term revenue trajectory with the industry's one-year growth forecast of 31% shows it's noticeably more attractive.
With this information, we can see why Diamond Power Infrastructure is trading at such a high P/S compared to the industry. It seems most investors are expecting this strong growth to continue and are willing to pay more for the stock.
What Does Diamond Power Infrastructure's P/S Mean For Investors?
Diamond Power Infrastructure's P/S has grown nicely over the last month thanks to a handy boost in the share price. Typically, we'd caution against reading too much into price-to-sales ratios when settling on investment decisions, though it can reveal plenty about what other market participants think about the company.
As we suspected, our examination of Diamond Power Infrastructure revealed its three-year revenue trends are contributing to its high P/S, given they look better than current industry expectations. In the eyes of shareholders, the probability of a continued growth trajectory is great enough to prevent the P/S from pulling back. If recent medium-term revenue trends continue, it's hard to see the share price falling strongly in the near future under these circumstances.
There are also other vital risk factors to consider before investing and we've discovered 2 warning signs for Diamond Power Infrastructure that you should be aware of.
If strong companies turning a profit tickle your fancy, then you'll want to check out this free list of interesting companies that trade on a low P/E (but have proven they can grow earnings).
New: Manage All Your Stock Portfolios in One Place
We've created the ultimate portfolio companion for stock investors, and it's free.
• Connect an unlimited number of Portfolios and see your total in one currency
• Be alerted to new Warning Signs or Risks via email or mobile
• Track the Fair Value of your stocks
Have feedback on this article? Concerned about the content? Get in touch with us directly. Alternatively, email editorial-team (at) simplywallst.com.
This article by Simply Wall St is general in nature. We provide commentary based on historical data and analyst forecasts only using an unbiased methodology and our articles are not intended to be financial advice. It does not constitute a recommendation to buy or sell any stock, and does not take account of your objectives, or your financial situation. We aim to bring you long-term focused analysis driven by fundamental data. Note that our analysis may not factor in the latest price-sensitive company announcements or qualitative material. Simply Wall St has no position in any stocks mentioned.
Have feedback on this article? Concerned about the content? Get in touch with us directly. Alternatively, email editorial-team@simplywallst.com
About NSEI:DIACABS
Diamond Power Infrastructure
Manufactures and sells power transmission equipment.
Proven track record with low risk.
Market Insights
Community Narratives


Recently Updated Narratives

TAV Havalimanlari Holding will fly high with 25.68% revenue growth


Fiducian: Compliance Clouds or Value Opportunity?


Q3 Outlook modestly optimistic
Popular Narratives


MicroVision will explode future revenue by 380.37% with a vision towards success


The company that turned a verb into a global necessity and basically runs the modern internet, digital ads, smartphones, maps, and AI.


