- India
- /
- Aerospace & Defense
- /
- NSEI:DATAPATTNS
The Returns At Data Patterns (India) (NSE:DATAPATTNS) Aren't Growing

Did you know there are some financial metrics that can provide clues of a potential multi-bagger? Ideally, a business will show two trends; firstly a growing return on capital employed (ROCE) and secondly, an increasing amount of capital employed. Ultimately, this demonstrates that it's a business that is reinvesting profits at increasing rates of return. That's why when we briefly looked at Data Patterns (India)'s (NSE:DATAPATTNS) ROCE trend, we were pretty happy with what we saw.
What Is Return On Capital Employed (ROCE)?
For those that aren't sure what ROCE is, it measures the amount of pre-tax profits a company can generate from the capital employed in its business. The formula for this calculation on Data Patterns (India) is:
Return on Capital Employed = Earnings Before Interest and Tax (EBIT) ÷ (Total Assets - Current Liabilities)
0.16 = ₹1.9b ÷ (₹15b - ₹2.5b) (Based on the trailing twelve months to December 2023).
Therefore, Data Patterns (India) has an ROCE of 16%. In absolute terms, that's a pretty normal return, and it's somewhat close to the Aerospace & Defense industry average of 15%.
See our latest analysis for Data Patterns (India)
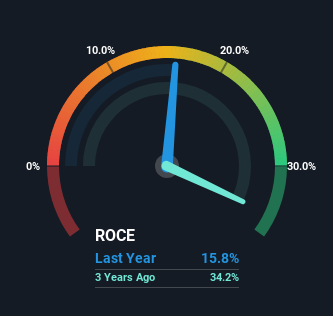
In the above chart we have measured Data Patterns (India)'s prior ROCE against its prior performance, but the future is arguably more important. If you'd like to see what analysts are forecasting going forward, you should check out our free analyst report for Data Patterns (India) .
The Trend Of ROCE
The trend of ROCE doesn't stand out much, but returns on a whole are decent. The company has employed 603% more capital in the last four years, and the returns on that capital have remained stable at 16%. Since 16% is a moderate ROCE though, it's good to see a business can continue to reinvest at these decent rates of return. Over long periods of time, returns like these might not be too exciting, but with consistency they can pay off in terms of share price returns.
One more thing to note, even though ROCE has remained relatively flat over the last four years, the reduction in current liabilities to 17% of total assets, is good to see from a business owner's perspective. This can eliminate some of the risks inherent in the operations because the business has less outstanding obligations to their suppliers and or short-term creditors than they did previously.
The Bottom Line On Data Patterns (India)'s ROCE
To sum it up, Data Patterns (India) has simply been reinvesting capital steadily, at those decent rates of return. Therefore it's no surprise that shareholders have earned a respectable 60% return if they held over the last year. So while investors seem to be recognizing these promising trends, we still believe the stock deserves further research.
One more thing to note, we've identified 1 warning sign with Data Patterns (India) and understanding this should be part of your investment process.
For those who like to invest in solid companies, check out this free list of companies with solid balance sheets and high returns on equity.
Mobile Infrastructure for Defense and Disaster
The next wave in robotics isn't humanoid. Its fully autonomous towers delivering 5G, ISR, and radar in under 30 minutes, anywhere.
Get the investor briefing before the next round of contracts
Sponsored On Behalf of CiTechNew: Manage All Your Stock Portfolios in One Place
We've created the ultimate portfolio companion for stock investors, and it's free.
• Connect an unlimited number of Portfolios and see your total in one currency
• Be alerted to new Warning Signs or Risks via email or mobile
• Track the Fair Value of your stocks
Have feedback on this article? Concerned about the content? Get in touch with us directly. Alternatively, email editorial-team (at) simplywallst.com.
This article by Simply Wall St is general in nature. We provide commentary based on historical data and analyst forecasts only using an unbiased methodology and our articles are not intended to be financial advice. It does not constitute a recommendation to buy or sell any stock, and does not take account of your objectives, or your financial situation. We aim to bring you long-term focused analysis driven by fundamental data. Note that our analysis may not factor in the latest price-sensitive company announcements or qualitative material. Simply Wall St has no position in any stocks mentioned.
About NSEI:DATAPATTNS
Data Patterns (India)
Provides defense and aerospace electronics solutions in India.
Flawless balance sheet with reasonable growth potential.
Similar Companies
Market Insights

Weekly Picks

Early mover in a fast growing industry. Likely to experience share price volatility as they scale


A case for CA$31.80 (undiluted), aka 8,616% upside from CA$0.37 (an 86 bagger!).


Moderation and Stabilisation: HOLD: Fair Price based on a 4-year Cycle is $12.08
Recently Updated Narratives


Title: Market Sentiment Is Dead Wrong — Here's Why PSEC Deserves a Second Look


An amazing opportunity to potentially get a 100 bagger

Amazon: Why the World’s Biggest Platform Still Runs on Invisible Economics
Popular Narratives


MicroVision will explode future revenue by 380.37% with a vision towards success


Crazy Undervalued 42 Baggers Silver Play (Active & Running Mine)


NVDA: Expanding AI Demand Will Drive Major Data Center Investments Through 2026
Trending Discussion
