- India
- /
- Aerospace & Defense
- /
- NSEI:DATAPATTNS
Investors Appear Satisfied With Data Patterns (India) Limited's (NSE:DATAPATTNS) Prospects As Shares Rocket 28%
Despite an already strong run, Data Patterns (India) Limited (NSE:DATAPATTNS) shares have been powering on, with a gain of 28% in the last thirty days. Looking back a bit further, it's encouraging to see the stock is up 87% in the last year.
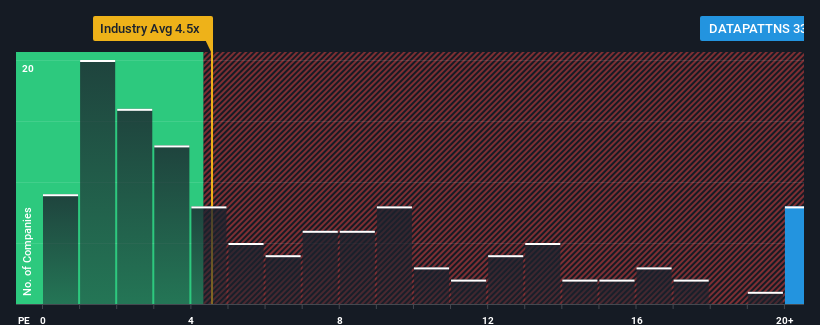
Following the firm bounce in price, when almost half of the companies in India's Aerospace & Defense industry have price-to-sales ratios (or "P/S") below 9.5x, you may consider Data Patterns (India) as a stock not worth researching with its 33.3x P/S ratio. Nonetheless, we'd need to dig a little deeper to determine if there is a rational basis for the highly elevated P/S.
Check out our latest analysis for Data Patterns (India)

What Does Data Patterns (India)'s Recent Performance Look Like?
With revenue growth that's superior to most other companies of late, Data Patterns (India) has been doing relatively well. It seems the market expects this form will continue into the future, hence the elevated P/S ratio. However, if this isn't the case, investors might get caught out paying too much for the stock.
If you'd like to see what analysts are forecasting going forward, you should check out our free report on Data Patterns (India).How Is Data Patterns (India)'s Revenue Growth Trending?
There's an inherent assumption that a company should far outperform the industry for P/S ratios like Data Patterns (India)'s to be considered reasonable.
Taking a look back first, we see that the company grew revenue by an impressive 19% last year. Pleasingly, revenue has also lifted 133% in aggregate from three years ago, thanks to the last 12 months of growth. So we can start by confirming that the company has done a great job of growing revenue over that time.
Shifting to the future, estimates from the six analysts covering the company suggest revenue should grow by 31% per year over the next three years. With the industry only predicted to deliver 19% each year, the company is positioned for a stronger revenue result.
With this in mind, it's not hard to understand why Data Patterns (India)'s P/S is high relative to its industry peers. Apparently shareholders aren't keen to offload something that is potentially eyeing a more prosperous future.
The Key Takeaway
The strong share price surge has lead to Data Patterns (India)'s P/S soaring as well. Typically, we'd caution against reading too much into price-to-sales ratios when settling on investment decisions, though it can reveal plenty about what other market participants think about the company.
We've established that Data Patterns (India) maintains its high P/S on the strength of its forecasted revenue growth being higher than the the rest of the Aerospace & Defense industry, as expected. At this stage investors feel the potential for a deterioration in revenues is quite remote, justifying the elevated P/S ratio. Unless these conditions change, they will continue to provide strong support to the share price.
It's always necessary to consider the ever-present spectre of investment risk. We've identified 1 warning sign with Data Patterns (India), and understanding should be part of your investment process.
If these risks are making you reconsider your opinion on Data Patterns (India), explore our interactive list of high quality stocks to get an idea of what else is out there.
New: Manage All Your Stock Portfolios in One Place
We've created the ultimate portfolio companion for stock investors, and it's free.
• Connect an unlimited number of Portfolios and see your total in one currency
• Be alerted to new Warning Signs or Risks via email or mobile
• Track the Fair Value of your stocks
Have feedback on this article? Concerned about the content? Get in touch with us directly. Alternatively, email editorial-team (at) simplywallst.com.
This article by Simply Wall St is general in nature. We provide commentary based on historical data and analyst forecasts only using an unbiased methodology and our articles are not intended to be financial advice. It does not constitute a recommendation to buy or sell any stock, and does not take account of your objectives, or your financial situation. We aim to bring you long-term focused analysis driven by fundamental data. Note that our analysis may not factor in the latest price-sensitive company announcements or qualitative material. Simply Wall St has no position in any stocks mentioned.
About NSEI:DATAPATTNS
Data Patterns (India)
Provides defense and aerospace electronics solutions in India.
Flawless balance sheet with reasonable growth potential.
Similar Companies
Market Insights
Weekly Picks


Crazy Undervalued 42 Baggers Silver Play (Active & Running Mine)


Fiducian: Compliance Clouds or Value Opportunity?

Willamette Valley Vineyards (WVVI): Not-So-Great Value
Recently Updated Narratives

Watch Pulse Seismic Outperform with 13.6% Revenue Growth in the Coming Years

Significantly undervalued gold explorer in Timmins, finally getting traction

Moderation and Stabilisation: HOLD: Fair Price based on a 4-year Cycle is $12.08
Popular Narratives


MicroVision will explode future revenue by 380.37% with a vision towards success


NVDA: Expanding AI Demand Will Drive Major Data Center Investments Through 2026


