
Advertisement
Declining Stock and Solid Fundamentals: Is The Market Wrong About AIA Engineering Limited (NSE:AIAENG)?
With its stock down 5.3% over the past three months, it is easy to disregard AIA Engineering (NSE:AIAENG). But if you pay close attention, you might gather that its strong financials could mean that the stock could potentially see an increase in value in the long-term, given how markets usually reward companies with good financial health. Specifically, we decided to study AIA Engineering's ROE in this article.
Return on equity or ROE is a key measure used to assess how efficiently a company's management is utilizing the company's capital. In short, ROE shows the profit each dollar generates with respect to its shareholder investments.
Check out our latest analysis for AIA Engineering
How Do You Calculate Return On Equity?
Return on equity can be calculated by using the formula:
Return on Equity = Net Profit (from continuing operations) ÷ Shareholders' Equity
So, based on the above formula, the ROE for AIA Engineering is:
17% = ₹11b ÷ ₹67b (Based on the trailing twelve months to June 2024).
The 'return' is the amount earned after tax over the last twelve months. One way to conceptualize this is that for each ₹1 of shareholders' capital it has, the company made ₹0.17 in profit.
What Has ROE Got To Do With Earnings Growth?
So far, we've learned that ROE is a measure of a company's profitability. Based on how much of its profits the company chooses to reinvest or "retain", we are then able to evaluate a company's future ability to generate profits. Generally speaking, other things being equal, firms with a high return on equity and profit retention, have a higher growth rate than firms that don’t share these attributes.
A Side By Side comparison of AIA Engineering's Earnings Growth And 17% ROE
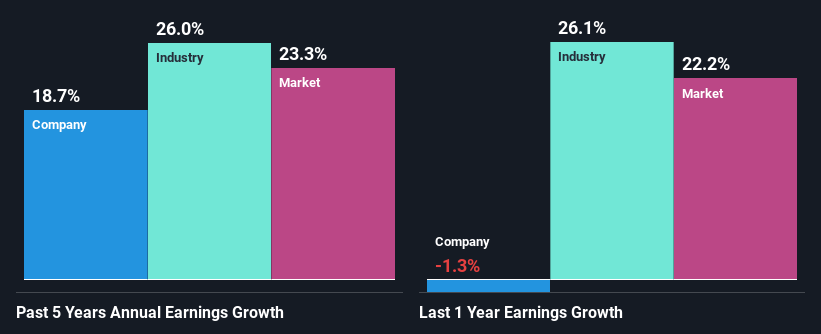
To begin with, AIA Engineering seems to have a respectable ROE. And on comparing with the industry, we found that the the average industry ROE is similar at 16%. This probably goes some way in explaining AIA Engineering's moderate 19% growth over the past five years amongst other factors.
We then compared AIA Engineering's net income growth with the industry and found that the company's growth figure is lower than the average industry growth rate of 26% in the same 5-year period, which is a bit concerning.
The basis for attaching value to a company is, to a great extent, tied to its earnings growth. The investor should try to establish if the expected growth or decline in earnings, whichever the case may be, is priced in. Doing so will help them establish if the stock's future looks promising or ominous. If you're wondering about AIA Engineering's's valuation, check out this gauge of its price-to-earnings ratio, as compared to its industry.
Is AIA Engineering Efficiently Re-investing Its Profits?
AIA Engineering's three-year median payout ratio to shareholders is 14% (implying that it retains 86% of its income), which is on the lower side, so it seems like the management is reinvesting profits heavily to grow its business.
Additionally, AIA Engineering has paid dividends over a period of at least ten years which means that the company is pretty serious about sharing its profits with shareholders. Upon studying the latest analysts' consensus data, we found that the company's future payout ratio is expected to rise to 22% over the next three years. Regardless, the ROE is not expected to change much for the company despite the higher expected payout ratio.
Summary
In total, we are pretty happy with AIA Engineering's performance. In particular, it's great to see that the company is investing heavily into its business and along with a high rate of return, that has resulted in a respectable growth in its earnings. With that said, the latest industry analyst forecasts reveal that the company's earnings growth is expected to slow down. To know more about the latest analysts predictions for the company, check out this visualization of analyst forecasts for the company.
New: Manage All Your Stock Portfolios in One Place
We've created the ultimate portfolio companion for stock investors, and it's free.
• Connect an unlimited number of Portfolios and see your total in one currency
• Be alerted to new Warning Signs or Risks via email or mobile
• Track the Fair Value of your stocks
Have feedback on this article? Concerned about the content? Get in touch with us directly. Alternatively, email editorial-team (at) simplywallst.com.
This article by Simply Wall St is general in nature. We provide commentary based on historical data and analyst forecasts only using an unbiased methodology and our articles are not intended to be financial advice. It does not constitute a recommendation to buy or sell any stock, and does not take account of your objectives, or your financial situation. We aim to bring you long-term focused analysis driven by fundamental data. Note that our analysis may not factor in the latest price-sensitive company announcements or qualitative material. Simply Wall St has no position in any stocks mentioned.
About NSEI:AIAENG
AIA Engineering
Designs, develops, produces, installs, and services high chromium, wear-resistant parts for grinding equipment used in the cement, mining, and quarry industries in India, the United Arab Emirates, and internationally.
Excellent balance sheet average dividend payer.
Similar Companies
Market Insights

Advertisement
Community Narratives
Finding The True Value Of A Logistics Powerhouse
Fair Value US$95.21|7.5% undervalued
NV
Community Contributor
Paradigm Biopharmaceuticals Will Lead Osteoarthritis Treatment with Zilosul's FDA Success
Fair Value AU$5.50|91.8% undervalued
AM
Community Contributor
Barrick Mining (ABX:CA): A Gold Hedge against a U.S. Shutdown
Fair Value CA$60.00|26.4% undervalued
GM
Community Contributor